Better Observability on Ruby on Rails Logs with OpenTelemetry Trace and Span ID (Part 2 - Improving Log Output)
February 24, 2023
In previous part you already know how to setup a simple (really simple) Rails application with one route. In this part, I will focusing on how we improve the log printed by the standard Rails application.
To recap, if you want to follow this article smoothly, you can use the code from previous part by cloning from my Github repository:
git clone https://github.com/yusufsyaifudin/rails-otel.git
And then checkout to the commit id c85c199 where is the last state of the code from previous article.:
git checkout c85c199c3a46ddb0a245f4ccd340bf5850fa17dd
As we already saw in the introduction article, when we’re running the Rails application, at default it will print the log output that look like this:
myapp  | Started GET "/list-vouchers" for 192.168.32.1 at 2023-03-09 03:26:00 +0000
myapp  | Cannot render console from 192.168.32.1! Allowed networks: 127.0.0.0/127.255.255.255, ::1
myapp  |   ActiveRecord::SchemaMigration Pluck (1.8ms)  SELECT "schema_migrations"."version" FROM "schema_migrations" ORDER BY "schema_migrations"."version" ASC
myapp  | Processing by UserPromotionController#list_vouchers as HTML
myapp  | request accepted by controller
myapp  | accepting token from headers
myapp  | validating JWT
myapp  | reaching business logic
myapp  | doing query get user by id c8c6991c-687e-44cc-8755-4743ef66d265
myapp  |   User Load (2.2ms)  SELECT "users".* FROM "users" WHERE "users"."id" = $1 LIMIT $2  [["id", "c8c6991c-687e-44cc-8755-4743ef66d265"], ["LIMIT", 1]]
myapp  |   ↳ app/services/vouchers/user_voucher.rb:7:in `vouchers'
myapp  | calling PromotionService.list_vouchers from UserVoucher.list_vouchers c8c6991c-687e-44cc-8755-4743ef66d265
myapp  | PromotionService.list_vouchers call started
myapp  | PromotionService.list_vouchers done
myapp  | controller done processing the request, preparing rendering response
myapp  | Completed 200 OK in 314ms (Views: 12.1ms | ActiveRecord: 9.0ms | Allocations: 8720)
Give Traffics to Rails Application #
Before we breaking down the problems that we may have in default Rails app, we need to make sure we have enough traffic to mock the high traffic that we may face in production. To do that, we need more than 1 users and concurrent access to our routes.
Preparing the data #
First, let us create 100 users, using rails console:
docker compose run --no-deps myapp rails console
Note:
Before you run this command, you need to make sure that the Rails application is active by running
docker compose up --build --force-recreatein separate terminal.
Then, inside rails console run this command to insert 100 users at once:
for counter in 1..100 do User::create(username: "user#{counter}", name: "User #{counter}") end
Above command will insert 100 user. Now, let’s create a JSON Web Token (JWT) on each user:
require_dependency "json_web_token"

tokens = []
for counter in 1..100 do
  username = "user#{counter}"
  token = JsonWebToken.encode({ user_id: User.find_by(username: username).id })
  tokens.push({username: username, token: token})
end

Dir.mkdir("scripts") unless Dir.exist?("scripts")
Dir.mkdir("scripts/loadtest") unless Dir.exist?("scripts/loadtest")
File.open("scripts/loadtest/tokens.json", 'w') {|f| f.write(tokens.to_json) }
This will create a file scripts/k6/tokens.json which contain a list of token and username in JSON array (in minified version) as follows:
[
  {
    "username": "user1",
    "token": "eyJhbGciOiJIUzI1NiJ9.eyJ1c2VyX2lkIjoiNmI4NzUyMWEtMTJhOC00MGUxLTkxZDEtYTU3YzAxZDM5N2YwIn0.Zpw7sm-SCW6lROcfU0CB3oOe1Fjsg5REDKCnNTfHkAk"
  }
]
Generate Traffic Using k6 Load Testing
#
First, we need to install k6 by following this instruction
https://k6.io/docs/get-started/installation/ or using Docker.
Then, create a file scripts/loadtest/list-vouchers.js:
import { check } from 'k6';
import { Counter } from 'k6/metrics';
import http from 'k6/http';
import { uuidv4 } from 'https://jslib.k6.io/k6-utils/1.4.0/index.js';

const successCounter = new Counter('success_counter');
const failedCounter = new Counter('failed_counter');

const payloads = JSON.parse(open('/scripts/loadtest/tokens.json'));
const randomIndex = Math.floor(Math.random() * payloads.length);
const payload = payloads[randomIndex];

export default function () {
  const params = {
    headers: {
      'X-Request-ID': uuidv4(),
      Authorization: payload.token,
    },
  };

  const serviceURL = __ENV.SERVICE_URL;
  const resp = http.get(serviceURL+'/list-vouchers', params);
  check(resp, {
    'status is 200': (r) => r.status === 200,
    'response contains expected username': (r) => r.json().user.username=== payload.username,
  });

  if (resp.status === 200) {
    successCounter.add(1);
  } else {
    failedCounter.add(1);
  }
}import { check } from 'k6';
import { Counter } from 'k6/metrics';
import http from 'k6/http';
import { uuidv4 } from 'https://jslib.k6.io/k6-utils/1.4.0/index.js';

const successCounter = new Counter('success_counter');
const failedCounter = new Counter('failed_counter');

const payloads = JSON.parse(open('/scripts/loadtest/tokens.json'));
const randomIndex = Math.floor(Math.random() * payloads.length);
const payload = payloads[randomIndex];

export default function () {
  const params = {
    headers: {
      'X-Request-ID': uuidv4(),
      Authorization: payload.token,
    },
  };

  const serviceURL = __ENV.SERVICE_URL;
  const resp = http.get(serviceURL+'/list-vouchers', params);
  check(resp, {
    'contains expected username': (r) => r.status === 200 && r.json().user.username=== payload.username,
  });

  if (resp.status === 200) {
    successCounter.add(1);
  } else {
    failedCounter.add(1);
  }
}
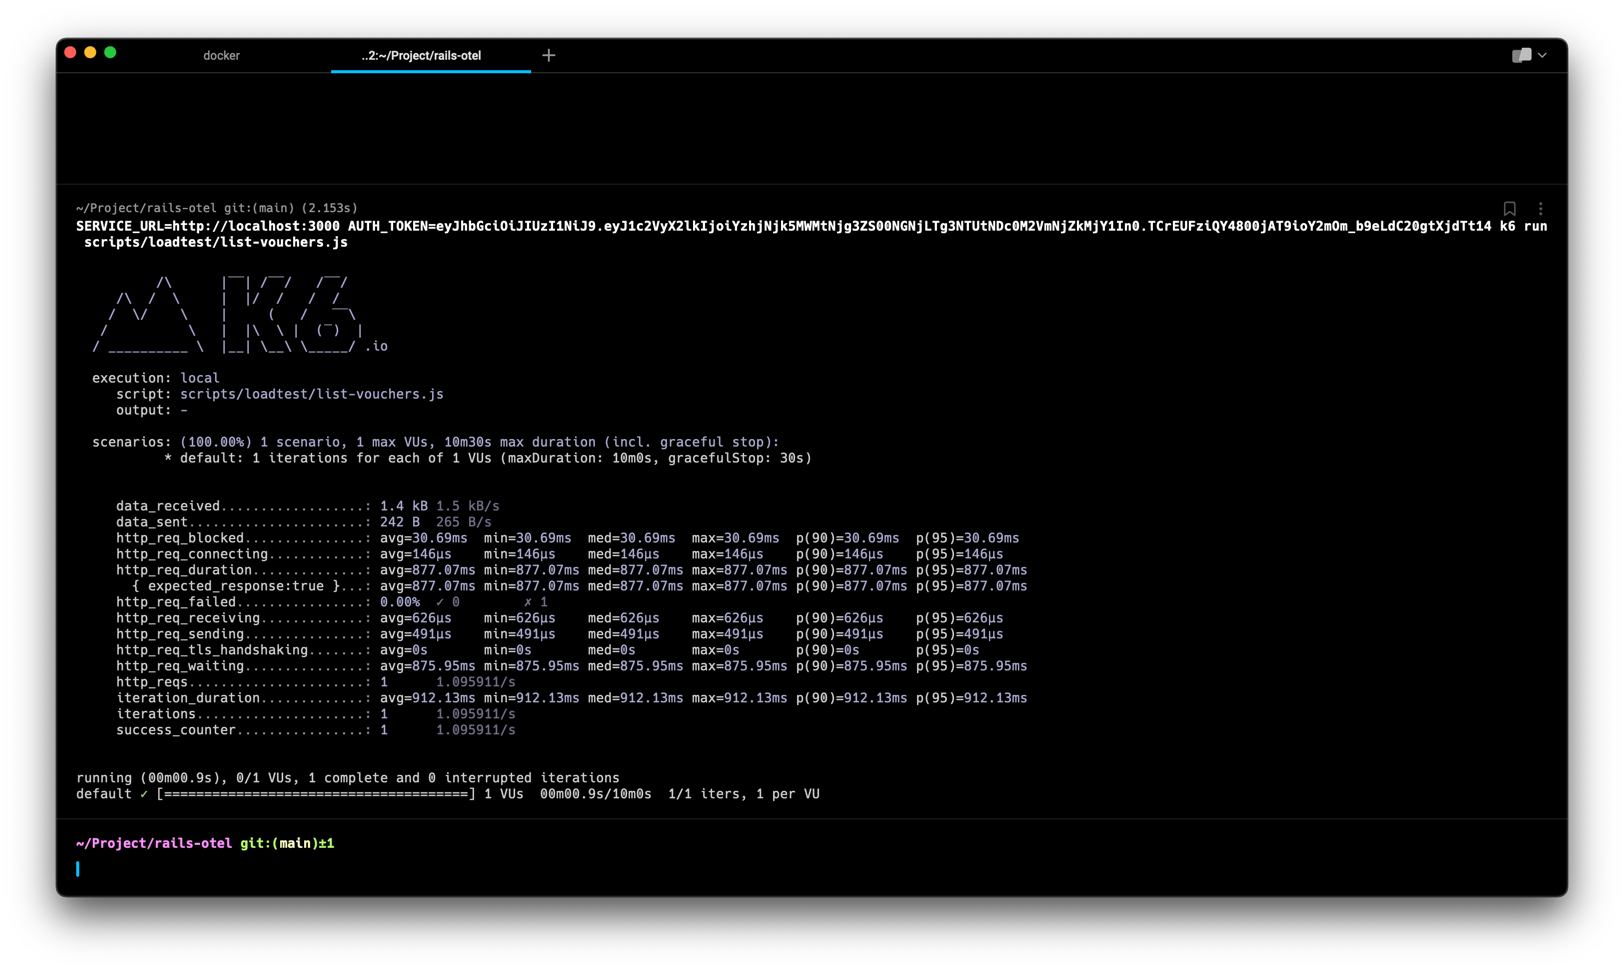
Now, run this command to do only one request using K6 Docker:
Don’t forget to use
--net=hostto make sure Docker access “localhost” to your Host machine
cat scripts/loadtest/list-vouchers.js | docker run \
 -e SERVICE_URL=http://localhost:3000 \
 -v $(pwd)/scripts/loadtest/tokens.json:/scripts/loadtest/tokens.json:ro \
 --net=host --platform linux/amd64 --rm -i grafana/k6:0.43.1 run -
If it runs with no issues, you will look the result like this:
SERVICE_URL=http://localhost:3000 AUTH_TOKEN=eyJhbGciOiJIUzI1NiJ9.eyJ1c2VyX2lkIjoiYzhjNjk5MWMtNjg3ZS00NGNjLTg3NTUtNDc0M2VmNjZkMjY1In0.TCrEUFziQY4800jAT9ioY2mOm_b9eLdC20gtXjdTt14 k6 run scripts/loadtest/list-vouchers.js

          /\      |‾‾| /‾‾/   /‾‾/
     /\  /  \     |  |/  /   /  /
    /  \/    \    |     (   /   ‾‾\
   /          \   |  |\  \ |  (‾)  |
  / __________ \  |__| \__\ \_____/ .io

  execution: local
     script: scripts/loadtest/list-vouchers.js
     output: -

  scenarios: (100.00%) 1 scenario, 1 max VUs, 10m30s max duration (incl. graceful stop):
           * default: 1 iterations for each of 1 VUs (maxDuration: 10m0s, gracefulStop: 30s)


     data_received..................: 1.4 kB 1.5 kB/s
     data_sent......................: 242 B  265 B/s
     http_req_blocked...............: avg=30.69ms  min=30.69ms  med=30.69ms  max=30.69ms  p(90)=30.69ms  p(95)=30.69ms
     http_req_connecting............: avg=146µs    min=146µs    med=146µs    max=146µs    p(90)=146µs    p(95)=146µs
     http_req_duration..............: avg=877.07ms min=877.07ms med=877.07ms max=877.07ms p(90)=877.07ms p(95)=877.07ms
       { expected_response:true }...: avg=877.07ms min=877.07ms med=877.07ms max=877.07ms p(90)=877.07ms p(95)=877.07ms
     http_req_failed................: 0.00%  ✓ 0        ✗ 1
     http_req_receiving.............: avg=626µs    min=626µs    med=626µs    max=626µs    p(90)=626µs    p(95)=626µs
     http_req_sending...............: avg=491µs    min=491µs    med=491µs    max=491µs    p(90)=491µs    p(95)=491µs
     http_req_tls_handshaking.......: avg=0s       min=0s       med=0s       max=0s       p(90)=0s       p(95)=0s
     http_req_waiting...............: avg=875.95ms min=875.95ms med=875.95ms max=875.95ms p(90)=875.95ms p(95)=875.95ms
     http_reqs......................: 1      1.095911/s
     iteration_duration.............: avg=912.13ms min=912.13ms med=912.13ms max=912.13ms p(90)=912.13ms p(95)=912.13ms
     iterations.....................: 1      1.095911/s
     success_counter................: 1      1.095911/s


running (00m00.9s), 0/1 VUs, 1 complete and 0 interrupted iterations
default ✓ [======================================] 1 VUs  00m00.9s/10m0s  1/1 iters, 1 per VU
And the Rails log output will look like this:
myapp  | Started GET "/list-vouchers" for 192.168.32.1 at 2023-03-09 03:26:00 +0000
myapp  | Cannot render console from 192.168.32.1! Allowed networks: 127.0.0.0/127.255.255.255, ::1
myapp  |   ActiveRecord::SchemaMigration Pluck (1.8ms)  SELECT "schema_migrations"."version" FROM "schema_migrations" ORDER BY "schema_migrations"."version" ASC
myapp  | Processing by UserPromotionController#list_vouchers as HTML
myapp  | request accepted by controller
myapp  | accepting token from headers
myapp  | validating JWT
myapp  | reaching business logic
myapp  | doing query get user by id c8c6991c-687e-44cc-8755-4743ef66d265
myapp  |   User Load (2.2ms)  SELECT "users".* FROM "users" WHERE "users"."id" = $1 LIMIT $2  [["id", "c8c6991c-687e-44cc-8755-4743ef66d265"], ["LIMIT", 1]]
myapp  |   ↳ app/services/vouchers/user_voucher.rb:7:in `vouchers'
myapp  | calling PromotionService.list_vouchers from UserVoucher.list_vouchers c8c6991c-687e-44cc-8755-4743ef66d265
myapp  | PromotionService.list_vouchers call started
myapp  | PromotionService.list_vouchers done
myapp  | controller done processing the request, preparing rendering response
myapp  | Completed 200 OK in 314ms (Views: 12.1ms | ActiveRecord: 9.0ms | Allocations: 8720)
myapp  |
myapp  |

At this point, we already have a working Rails app that show the default log output format. In the next section, I will show you what we can improve with the log output.
You can see changes in this section (adding k6 load testing script) here:
3548129
Breaking down the problem #
In the Introduction I quoted the ChatGPT responses on “why rails app log hard to debug”.
In this section, I will give some proof of the statements.
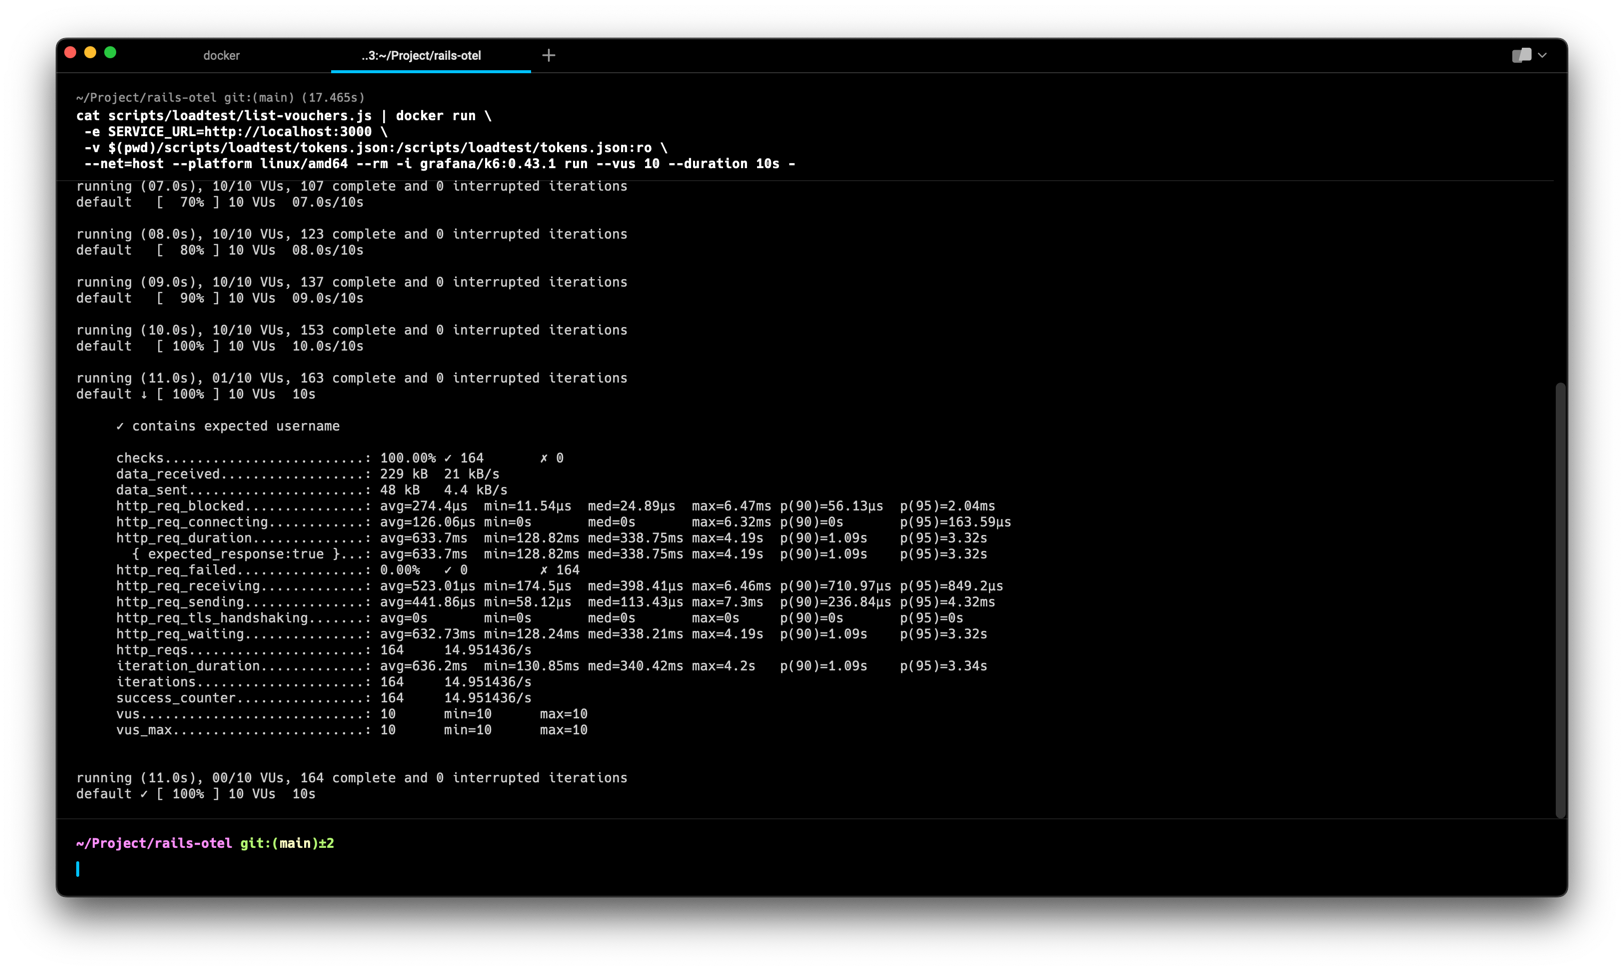
From the previous section, lets we do more request using k6 with 10 VUs (Virtual Users) for 10 seconds:
cat scripts/loadtest/list-vouchers.js | docker run \
 -e SERVICE_URL=http://localhost:3000 \
 -v $(pwd)/scripts/loadtest/tokens.json:/scripts/loadtest/tokens.json:ro \
 --net=host --platform linux/amd64 --rm -i grafana/k6:0.43.1 run --vus 10 --duration 10s -
As we can see in Figure 3, we already give our Rails app with 164 requests (you can see in the iterations in the Figure 3).
This number may different each time you run the k6 load testing, it depends on multi-factor.
iterations.....................: 164 14.951436/s
In Figure 4 below, we can see that the Rails logger now is harder to read.
Rails Log Output Become Hard To Read
myapp  | Processing by UserPromotionController#list_vouchers as HTML
myapp  | request accepted by controller
myapp  | accepting token from headers
myapp  | validating JWT
myapp  | reaching business logic
myapp  | doing query get user by id dd2865e6-4529-44c3-b475-f3cfa3eb6551
myapp  |   User Load (0.2ms)  SELECT "users".* FROM "users" WHERE "users"."id" = $1 LIMIT $2  [["id", "dd2865e6-4529-44c3-b475-f3cfa3eb6551"], ["LIMIT", 1]]
myapp  |   ↳ app/services/vouchers/user_voucher.rb:7:in `vouchers'
myapp  | calling PromotionService.list_vouchers from UserVoucher.list_vouchers dd2865e6-4529-44c3-b475-f3cfa3eb6551
myapp  | PromotionService.list_vouchers call started
myapp  | PromotionService.list_vouchers done
myapp  | controller done processing the request, preparing rendering response
myapp  | Completed 200 OK in 152ms (Views: 0.6ms | ActiveRecord: 0.7ms | Allocations: 5057)
myapp  |
myapp  |
myapp  | PromotionService.list_vouchers done
myapp  | controller done processing the request, preparing rendering response
myapp  | Completed 200 OK in 139ms (Views: 0.4ms | ActiveRecord: 0.2ms | Allocations: 1649)
myapp  |
myapp  |
myapp  | Started GET "/list-vouchers" for 192.168.80.1 at 2023-03-09 09:32:28 +0000
myapp  | Cannot render console from 192.168.80.1! Allowed networks: 127.0.0.0/127.255.255.255, ::1
myapp  | Processing by UserPromotionController#list_vouchers as HTML
myapp  | request accepted by controller
myapp  | accepting token from headers
myapp  | validating JWT
myapp  | reaching business logic
myapp  | doing query get user by id 99dca0af-84f2-4e9f-9925-66a5b6442c2a
myapp  |   User Load (0.3ms)  SELECT "users".* FROM "users" WHERE "users"."id" = $1 LIMIT $2  [["id", "99dca0af-84f2-4e9f-9925-66a5b6442c2a"], ["LIMIT", 1]]
myapp  |   ↳ app/services/vouchers/user_voucher.rb:7:in `vouchers'
myapp  | calling PromotionService.list_vouchers from UserVoucher.list_vouchers 99dca0af-84f2-4e9f-9925-66a5b6442c2a
myapp  | PromotionService.list_vouchers call started
myapp  | PromotionService.list_vouchers done
myapp  | controller done processing the request, preparing rendering response
myapp  | Completed 200 OK in 496ms (Views: 0.8ms | ActiveRecord: 0.4ms | Allocations: 11963)
myapp  |
myapp  |
myapp  | PromotionService.list_vouchers done
myapp  | controller done processing the request, preparing rendering response
myapp  | Completed 200 OK in 371ms (Views: 0.7ms | ActiveRecord: 0.3ms | Allocations: 8049)
myapp  |
myapp  |
myapp  | PromotionService.list_vouchers done
myapp  | controller done processing the request, preparing rendering response
myapp  | Completed 200 OK in 319ms (Views: 1.8ms | ActiveRecord: 0.3ms | Allocations: 2298)
myapp  |
myapp  |
Complexity and Volume #
Rails applications can be complex with many layers of code that interact with each other. This can make it difficult to pinpoint the root cause of an issue.
As you can see in Figure 4, when we have high traffic, the Rails log become hard to read because some log may delayed to print, so we cannot see the right order of the logs line. If we adding the timestamp at the front of each log lines, we still cannot get the better understanding because it is uncommon to sorting the unstructured logs. See also #Lack of context.
Rails logs can generate a large volume of information, making it difficult to find the relevant information needed to debug an issue.
Also, since the we have a large volumes of log, we need a good tooling which can be easier to query and filter to show log that we need to see.
Lack of structure #
Rails logs can lack structure, making it difficult to identify the relevant information needed to debug an issue.
Structured log is easier to query and makes developer easier to pin-point the issues. For example, the Customer Service got the complaint from User U at time T that the application become unresponsive. The Customer Service then can open the ticket and let the developer to see the log only for that user at that time. If we still have unstructured log as shown in Figure 4, how we can do that?
If we have a structured log, (let say JSON formatted), we can pipe all these logs into Elasticsearch and query it using Kibana (or renowned as ELK Stack. As an alternative, we can use Grafana Loki to query it from Cassandra or AWS DynamoDB. JSON is preferred because developers should familiar with that kind of format as it commonly used in REST API request/response payload.
Lack of context #
Rails logs may not provide enough context to understand the flow of the application, making it difficult to understand how the different parts of the application are interacting.
At Figure 4, we see Completed 200 OK three times at the end of the logs. But, how can we know the previous process that related to this line? Why at first we got 496ms, then 371ms and then 319ms? If at some point we see the number is more than 10 seconds, how can we know the related log that causing the process took too long?
Lack of tooling #
Traditional text editors or command line tools may not be well suited for analyzing logs, and dedicated log analysis tools can be expensive or require specialized knowledge.
As I mention in
#Lack of structure, it is more easier to query using JSON that text. Even if we are only using terminal, with JSON we can do some query using
jq or its alternative
gojq. But, I do prefer if we save it into some persistent storage (with some TTL to reduce cost of storage) and query them via dashboard UI (like Grafana Loki or Kibana).
Refactoring Log Output To Structured Log #
After we acknowledge that there is a problem with our Rails app, we can then try to improve our log starting with making it as JSON output per log line.
We will refactor our log output to JSON, with this minimal structure:
{
  "level": "INFO", // Required. Level of the log:
  "time": "2023-03-13T09:07:48.639Z", // Required. Time when the log is written in RFC3339 Nano https://www.rfc-editor.org/rfc/rfc3339
  "msg": "message of this log", // Required.
  "trace_id": "00000000000000000000000000000000", // Required. hex-encoded.
  "span_id": "0000000000000000", // Required. hex-encoded.
  "trace_flags": "00", // Required. formatted according to W3C traceflags format.
  "node_id": "8689d48b-d323-4492-a989-b9fb7f7ad81a", // Required. UUID string that will always the same from start to stop. If restart, this ID MUST be generated again, so we can detect that two logs is come from different restart count.
  "progname": "rails-otel", // Required. Service name that produce this log. This MUST contain lower-case and alphanumeric string only (dash or underscore is used as space replacement, no other character permitted).
  "request_id": "", // Optional. Only appeared when the log is triggered via request-response model API (HTTP, gRPC, or anything)
  "attributes": [{"key": "value"}], // Optional. Contains Array of object (key-value) format,,
  "data": {} // Optional, can contain array or anything depend on the log you want to write.
}
Change the Booting Output #
Since in booting process we cannot get any information regarding the
Add this line into file config/boot.rb:
require 'securerandom'
require "rails/command" # Allow for base class autoload
require "rails/commands/server/server_command" # Load the ServerCommand class

RAILS_NODE_ID = SecureRandom.uuid
PROGRAM_NAME = ENV['PROGRAM_NAME'] || 'no-service-name'

# https://stackoverflow.com/a/75651939
Rails::Command::ServerCommand.class_eval do
  # print_boot_information override the original method to make all log turn into JSON
  # https://github.com/rails/rails/blob/7c70791470fc517deb7c640bead9f1b47efb5539/railties/lib/rails/commands/server/server_command.rb#L278-L284
  # 7c70791 is commit hash for release tag: https://github.com/rails/rails/releases/tag/v7.0.4.2
  # If you have different version of Rails, this method may not work!
  def print_boot_information(server, url)
    logs = [
      "Booting #{ActiveSupport::Inflector.demodulize(server)}",
      "Rails #{Rails.version} application starting in #{Rails.env} #{url}",
      "Run `bin/rails server --help` for more startup options"
    ]

    ts = Time.now
    logs.each do |log|
      json_log = {
        level: "UNKNOWN",
        time: ts,
        msg: log,
        trace_id: '00000000000000000000000000000000',
        span_id: '0000000000000000',
        trace_flags: '00',
        node_id: RAILS_NODE_ID,
        progname: PROGRAM_NAME,
      }.to_json

      STDOUT.puts(json_log)
    end
  end
end
Then, as we are using Puma as our server, we need to configure Puma log output into JSON by adding these line in the file config/puma.rb:
# Use JSON format for booting logs
ts = Time.now
log_formatter do |str|

  line = {
    level: "UNKNOWN",
    time: ts,
    msg: str.delete_prefix('*').chomp().strip(),
    trace_id: '00000000000000000000000000000000',
    span_id: '0000000000000000',
    trace_flags: '00',
    node_id: RAILS_NODE_ID,
    progname: PROGRAM_NAME,
  }.to_json

  STDOUT.puts(line)
end
You may notice that we add global constant PROGRAM_NAME by getting its value from environment variable ENV['PROGRAM_NAME'], so we need to add the environment variable to docker-compose.yml:
  16 environment:
  17   DATABASE_USERNAME: root
  18   DATABASE_PASSWORD: password
  19   DATABASE_DB_NAME: rails_otel_dev
+ 20   PROGRAM_NAME: 'rails-otel'
  21
Now, restart the server by running:
docker compose up --build --force-recreate
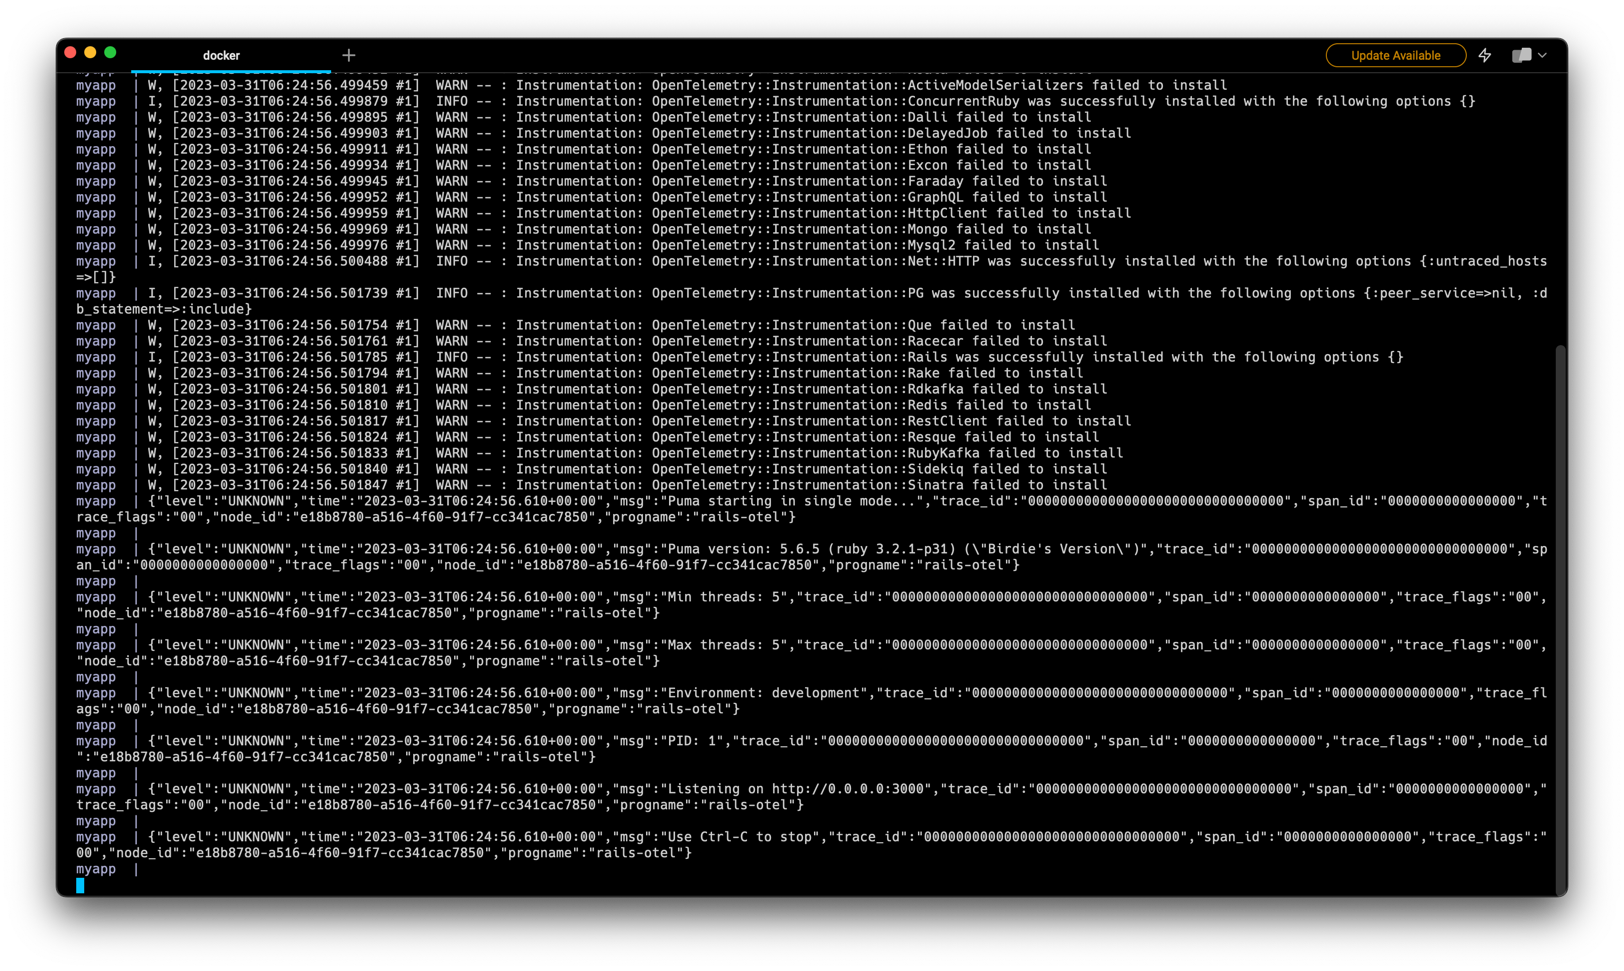
Voilà, you’ll see that now our log become structured JSON.
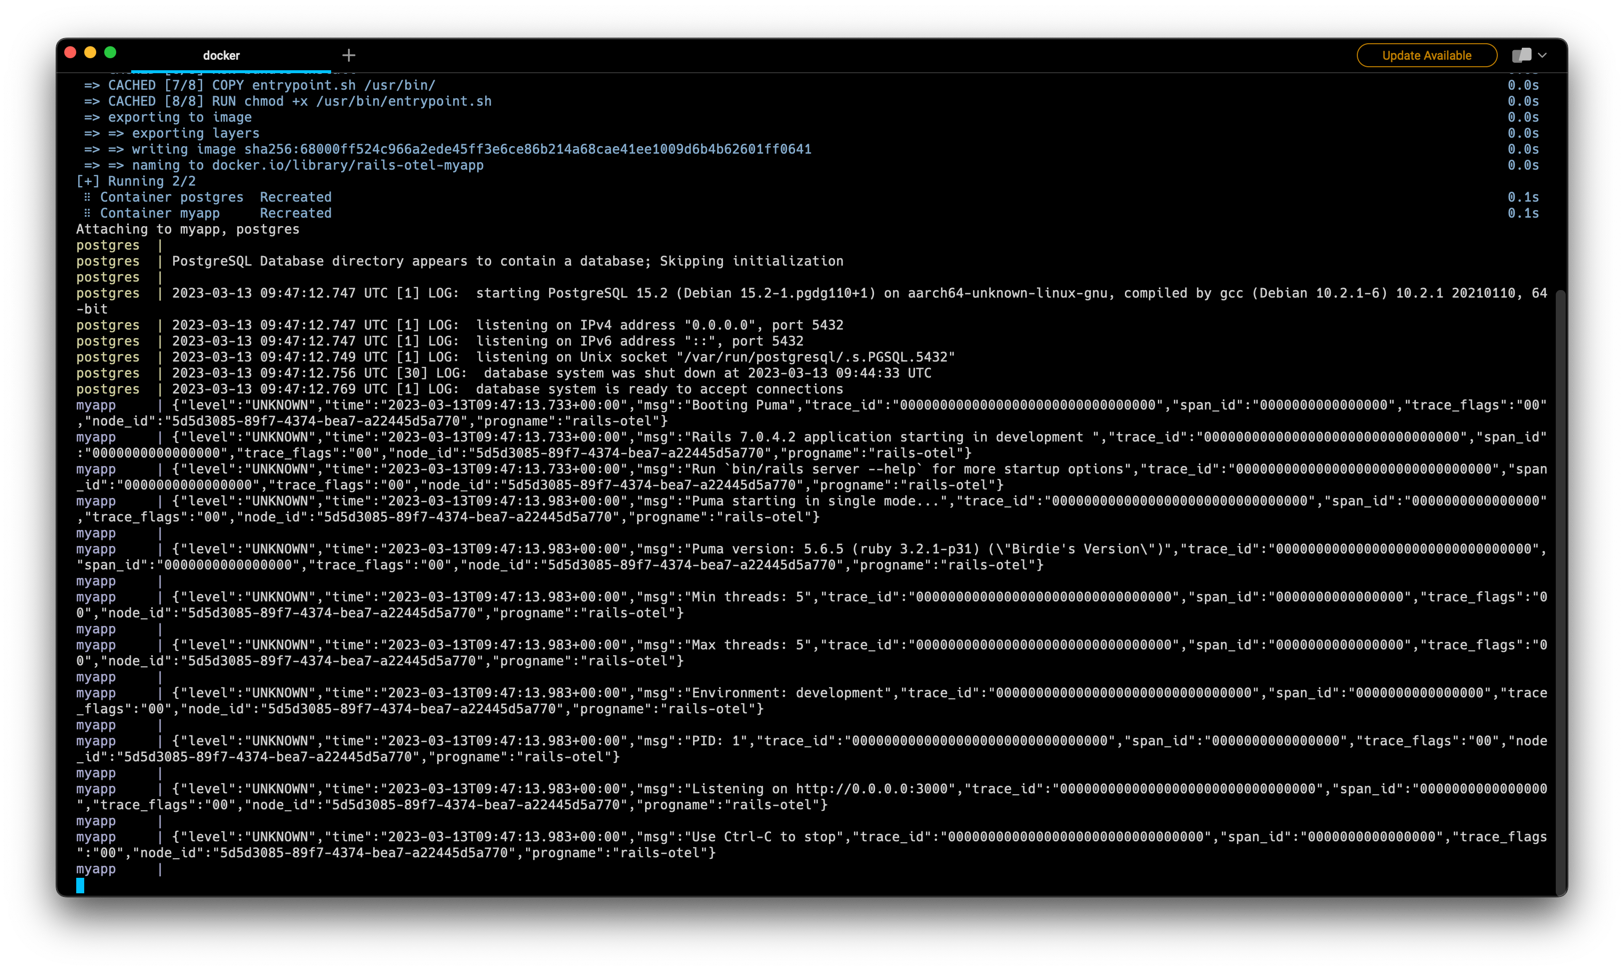
{"level":"UNKNOWN","time":"2023-03-13T09:47:13.733+00:00","msg":"Booting Puma","trace_id":"00000000000000000000000000000000","span_id":"0000000000000000","trace_flags":"00","node_id":"5d5d3085-89f7-4374-bea7-a22445d5a770","progname":"rails-otel"}
{"level":"UNKNOWN","time":"2023-03-13T09:47:13.733+00:00","msg":"Rails 7.0.4.2 application starting in development ","trace_id":"00000000000000000000000000000000","span_id":"0000000000000000","trace_flags":"00","node_id":"5d5d3085-89f7-4374-bea7-a22445d5a770","progname":"rails-otel"}
{"level":"UNKNOWN","time":"2023-03-13T09:47:13.733+00:00","msg":"Run `bin/rails server --help` for more startup options","trace_id":"00000000000000000000000000000000","span_id":"0000000000000000","trace_flags":"00","node_id":"5d5d3085-89f7-4374-bea7-a22445d5a770","progname":"rails-otel"}
{"level":"UNKNOWN","time":"2023-03-13T09:47:13.983+00:00","msg":"Puma starting in single mode...","trace_id":"00000000000000000000000000000000","span_id":"0000000000000000","trace_flags":"00","node_id":"5d5d3085-89f7-4374-bea7-a22445d5a770","progname":"rails-otel"}
{"level":"UNKNOWN","time":"2023-03-13T09:47:13.983+00:00","msg":"Puma version: 5.6.5 (ruby 3.2.1-p31) (\"Birdie's Version\")","trace_id":"00000000000000000000000000000000","span_id":"0000000000000000","trace_flags":"00","node_id":"5d5d3085-89f7-4374-bea7-a22445d5a770","progname":"rails-otel"}
{"level":"UNKNOWN","time":"2023-03-13T09:47:13.983+00:00","msg":"Min threads: 5","trace_id":"00000000000000000000000000000000","span_id":"0000000000000000","trace_flags":"00","node_id":"5d5d3085-89f7-4374-bea7-a22445d5a770","progname":"rails-otel"}
{"level":"UNKNOWN","time":"2023-03-13T09:47:13.983+00:00","msg":"Max threads: 5","trace_id":"00000000000000000000000000000000","span_id":"0000000000000000","trace_flags":"00","node_id":"5d5d3085-89f7-4374-bea7-a22445d5a770","progname":"rails-otel"}
{"level":"UNKNOWN","time":"2023-03-13T09:47:13.983+00:00","msg":"Environment: development","trace_id":"00000000000000000000000000000000","span_id":"0000000000000000","trace_flags":"00","node_id":"5d5d3085-89f7-4374-bea7-a22445d5a770","progname":"rails-otel"}
{"level":"UNKNOWN","time":"2023-03-13T09:47:13.983+00:00","msg":"PID: 1","trace_id":"00000000000000000000000000000000","span_id":"0000000000000000","trace_flags":"00","node_id":"5d5d3085-89f7-4374-bea7-a22445d5a770","progname":"rails-otel"}
{"level":"UNKNOWN","time":"2023-03-13T09:47:13.983+00:00","msg":"Listening on http://0.0.0.0:3000","trace_id":"00000000000000000000000000000000","span_id":"0000000000000000","trace_flags":"00","node_id":"5d5d3085-89f7-4374-bea7-a22445d5a770","progname":"rails-otel"}
{"level":"UNKNOWN","time":"2023-03-13T09:47:13.983+00:00","msg":"Use Ctrl-C to stop","trace_id":"00000000000000000000000000000000","span_id":"0000000000000000","trace_flags":"00","node_id":"5d5d3085-89f7-4374-bea7-a22445d5a770","progname":"rails-otel"}
Changes on this section can be seen at this commit 21a4666.
Add OpenTelemetry SDK #
Before configuring the rest of logger to JSON, we need to add OpenTelemetry to get the actual trace_id and span_id.
This is the advantages using OpenTelemetry SDK:
- We don’t need to re-invent the wheel on how ID should be generated and formatted.
- If we have enough budget, we can deploy Jaeger or Grafana or using provider such as DataDog or NewRelic to see our app trace.
Then we can also correlate logs and traces with the same
trace_id.- But, if we don’t have enough resources (either human resource or infrastructure), we can disable OpenTelemetry to push and just use the SDK itself to generate.
First, we need to install OpenTelemetry Gem SDK:
+ 60 # A stats collection and distributed tracing framework
+ 61 gem 'opentelemetry-sdk', '1.2'
+ 62
+ 63 # OTLP exporter for the OpenTelemetry framework
+ 64 gem 'opentelemetry-exporter-otlp', '0.24.0'
+ 65
+ 66 # All-in-one instrumentation bundle for the OpenTelemetry framework
+ 67 # Provides instrumentations for Rails, Sinatra, several HTTP libraries, and more.
+ 68 gem 'opentelemetry-instrumentation-all', '0.31.0'
+ 69
Then, create a file config/initializers/opentelemetry.rb with following code:
require 'opentelemetry/sdk'
require 'opentelemetry/exporter/otlp'
require 'opentelemetry/instrumentation/all'

# Custom exporter to make print to STDOUT
class MyExporter < OpenTelemetry::Exporter::OTLP::Exporter
  # Override function here:
  # https://github.com/open-telemetry/opentelemetry-ruby/blob/opentelemetry-sdk/v1.2.0/exporter/otlp/lib/opentelemetry/exporter/otlp/exporter.rb#L79-L90
  def export(span_data, timeout: nil)
    # Custom logic for exporting data goes here
    STDOUT.puts("Exporting data: #{span_data.inspect}")
    return OpenTelemetry::SDK::Trace::Export::SUCCESS
  end
end

# Exporter and Processor configuration
# See list of arguments here https://github.com/open-telemetry/opentelemetry-ruby/blob/opentelemetry-sdk/v1.2.0/exporter/otlp/lib/opentelemetry/exporter/otlp/exporter.rb#L48-L54
# As of March 15th, 2023, the gRPC exporter is not published to Rubygems and marked as not production ready.
# See https://github.com/open-telemetry/opentelemetry-ruby/issues/1337
# So, we can only use HTTP for now.
OTEL_EXPORTER = OpenTelemetry::Exporter::OTLP::Exporter.new(
  endpoint: ENV['OTEL_EXPORTER_OTLP_ENDPOINT'],
)

# Use this custom exporter if we want to log into STDOUT only, or implement another exporter (such as no-operation).
# OTEL_EXPORTER = MyExporter.new()

# See https://github.com/open-telemetry/opentelemetry-ruby/blob/opentelemetry-sdk/v1.2.0/sdk/lib/opentelemetry/sdk/trace/export/batch_span_processor.rb#L47-L53
processor = OpenTelemetry::SDK::Trace::Export::BatchSpanProcessor.new(OTEL_EXPORTER)

OpenTelemetry::SDK.configure do |c|

  c.resource = OpenTelemetry::SDK::Resources::Resource.create({
    OpenTelemetry::SemanticConventions::Resource::SERVICE_NAMESPACE => 'rails-app',
    OpenTelemetry::SemanticConventions::Resource::SERVICE_NAME => PROGRAM_NAME.to_s, # Global variable PROGRAM_NAME already defined in config/boot.rb
    OpenTelemetry::SemanticConventions::Resource::SERVICE_INSTANCE_ID => Socket.gethostname(),
    OpenTelemetry::SemanticConventions::Resource::SERVICE_VERSION => "0.0.0", # we can get it from environment variable
  })

  # enables all instrumentation!
  c.use_all()

  # Or, if you prefer to filter specific instrumentation,
  # you can pick some of them like this https://scoutapm.com/blog/configuring-opentelemetry-in-ruby
  ##### Instruments
  # c.use 'OpenTelemetry::Instrumentation::Rack'
  # c.use 'OpenTelemetry::Instrumentation::ActionPack'
  # c.use 'OpenTelemetry::Instrumentation::ActionView'
  # c.use 'OpenTelemetry::Instrumentation::ActiveJob'
  # c.use 'OpenTelemetry::Instrumentation::ActiveRecord'
  # c.use 'OpenTelemetry::Instrumentation::ConcurrentRuby'
  # c.use 'OpenTelemetry::Instrumentation::Faraday'
  # c.use 'OpenTelemetry::Instrumentation::HttpClient'
  # c.use 'OpenTelemetry::Instrumentation::Net::HTTP'
  # c.use 'OpenTelemetry::Instrumentation::PG', {
  #   # By default, this instrumentation includes the executed SQL as the `db.statement`
  #   # semantic attribute. Optionally, you may disable the inclusion of this attribute entirely by
  #   # setting this option to :omit or sanitize the attribute by setting to :obfuscate
  #   db_statement: :obfuscate,
  # }
  # c.use 'OpenTelemetry::Instrumentation::Rails'
  # c.use 'OpenTelemetry::Instrumentation::Redis'
  # c.use 'OpenTelemetry::Instrumentation::RestClient'
  # c.use 'OpenTelemetry::Instrumentation::RubyKafka'
  # c.use 'OpenTelemetry::Instrumentation::Sidekiq'

  # Set OpenTelemetry library logger
  c.logger = Logger.new(STDOUT)

  # Exporter and Processor configuration
  c.add_span_processor(processor)
end

# 'MyAppTracer' can be used throughout your code now
MyAppTracer = OpenTelemetry.tracer_provider.tracer(PROGRAM_NAME, '0.0.0')
In above code, we are using HTTP to send the trace data to OpenTelemetry. But, if you wish to not send it, we can only print it (or entirely disable it) by using custom OpenTelemetry exporter MyExporter and change the exporter to OTEL_EXPORTER = MyExporter.new().
Then, don’t forget to shutdown the OpenTelemetry exporter during app shutdown.
In file config/application.rb, add this following line:
+ 23
+ 24    # Add a callback to shut down the OpenTelemetry exporter and SDK
+ 25    config.after_initialize do
+ 26      at_exit do
+ 27        OTEL_EXPORTER.shutdown
+ 28      end
+ 29    end
+ 30
Now, we have OpenTelemetry SDK installed. Next, we need to use
OpenTelemetry Collector as agent to receives the traces produced by our app and
Jaeger as the dashboard. To do that, we can add this service in our docker-compose.yaml:
  jaeger:
    image: jaegertracing/all-in-one:1
    container_name: jaeger
    restart: always
    command:
      - '--collector.otlp.enabled=true'
    ports:
      - "5775:5775/udp"
      - "6831:6831/udp"
      - "6832:6832/udp"
      - "5778:5778"
      - "16686:16686" # dashboard
      - "14268:14268" # Accepts spans directly from clients in jaeger.thrift format with binary thrift protocol (POST to /api/traces). Also serves sampling policies at /api/sampling, similar to Agent’s port 5778.
      - "9411:9411" # Accepts Zipkin spans in Thrift, JSON and Proto (disabled by default).
      - "14269:14269" # Admin port: health check at / and metrics at /metrics.
      - "14317:4317" # gRPC Accepts traces in OpenTelemetry OTLP format if --collector.otlp.enabled=true.
      - "14318:4318" # HTTP Accepts traces in OpenTelemetry OTLP format if --collector.otlp.enabled=true.
      - "14250:14250" # Used by jaeger-agent to send spans in model.proto format.

  # Collector
  otel-collector:
    image: otel/opentelemetry-collector:0.69.0
    container_name: otel-collector
    command: [ "--config=/etc/otel-collector-config.yaml" ]
    volumes:
      - ./otel-collector-config.yaml:/etc/otel-collector-config.yaml:ro
      - ./docker-data/otel-collector/log:/tmp/log
    ports:
      - "1888:1888"   # pprof extension
      - "8888:8888"   # Prometheus' metrics exposed by the collector
      - "8889:8889"   # Prometheus exporter metrics
      - "13133:13133" # health_check extension
      - "4317:4317"   # OTLP gRPC receiver
      - "4318:4318"   # OTLP http receiver
      - "55679:55679" # zpages extension
    depends_on:
      - jaeger
Then, still in our docker-compose.yaml, we need to add jaeger as our app dependency and OTEL_EXPORTER_OTLP_ENDPOINT variable.
 14    depends_on:
 15      - postgres
+16      - jaeger
 17    environment:
 18      DATABASE_USERNAME: root
 19      DATABASE_PASSWORD: password
 20      DATABASE_DB_NAME: rails_otel_dev
 21      PROGRAM_NAME: 'rails-otel'
+22     OTEL_EXPORTER_OTLP_ENDPOINT: http://otel-collector:4318 # via HTTP
 23
As we need a file otel-collector-config.yaml to configure OpenTelemetry Collector, we need to create that file in our app root directory otel-collector-config.yaml:
receivers:
  # Data sources: traces, metrics, logs
  otlp:
    protocols:
      http:
        cors:
          allowed_origins:
            - "http://*"
            - "https://*"

processors:
  batch: {}

exporters:
  # Data sources: traces
  jaeger:
    endpoint: "jaeger:14250" # point to jaeger-agent to send spans in model.proto format.
    tls:
      insecure: true

  # Data sources: traces, metrics, logs
  logging:
    verbosity: detailed
    sampling_initial: 5
    sampling_thereafter: 200

  # Data sources: traces, metrics, logs
  file:
    path: /tmp/log/otel-log.json

service:
  pipelines:
    traces:
      receivers: [otlp]
      processors: [ batch ]
      exporters: [jaeger, logging, file]
The OpenTelemetry should have properly configured, now we can restart our service and let Docker to pull the jaegertracing/all-in-one:1 and otel/opentelemetry-collector:0.69.0 images.
docker compose up --build --force-recreate
We will see the log like this:
Rails Logger After Installing OpenTelemetry SDK
myapp  | {"level":"UNKNOWN","time":"2023-03-31T06:24:56.293+00:00","msg":"Booting Puma","trace_id":"00000000000000000000000000000000","span_id":"0000000000000000","trace_flags":"00","node_id":"e18b8780-a516-4f60-91f7-cc341cac7850","progname":"rails-otel"}
myapp  | {"level":"UNKNOWN","time":"2023-03-31T06:24:56.293+00:00","msg":"Rails 7.0.4.2 application starting in development ","trace_id":"00000000000000000000000000000000","span_id":"0000000000000000","trace_flags":"00","node_id":"e18b8780-a516-4f60-91f7-cc341cac7850","progname":"rails-otel"}
myapp  | {"level":"UNKNOWN","time":"2023-03-31T06:24:56.293+00:00","msg":"Run `bin/rails server --help` for more startup options","trace_id":"00000000000000000000000000000000","span_id":"0000000000000000","trace_flags":"00","node_id":"e18b8780-a516-4f60-91f7-cc341cac7850","progname":"rails-otel"}
myapp  | W, [2023-03-31T06:24:56.398800 #1]  WARN -- : Instrumentation: OpenTelemetry::Instrumentation::Trilogy failed to install
myapp  | I, [2023-03-31T06:24:56.399313 #1]  INFO -- : Instrumentation: OpenTelemetry::Instrumentation::ActiveSupport was successfully installed with the following options {}
myapp  | I, [2023-03-31T06:24:56.400173 #1]  INFO -- : Instrumentation: OpenTelemetry::Instrumentation::Rack was successfully installed with the following options {:allowed_request_headers=>[], :allowed_response_headers=>[], :application=>nil, :record_frontend_span=>false, :retain_middleware_names=>false, :untraced_endpoints=>[], :url_quantization=>nil, :untraced_requests=>nil, :response_propagators=>[]}
myapp  | I, [2023-03-31T06:24:56.403592 #1]  INFO -- : Instrumentation: OpenTelemetry::Instrumentation::ActionPack was successfully installed with the following options {}
myapp  | I, [2023-03-31T06:24:56.413223 #1]  INFO -- : Instrumentation: OpenTelemetry::Instrumentation::ActiveJob was successfully installed with the following options {:propagation_style=>:link, :force_flush=>false, :span_naming=>:queue}
myapp  | I, [2023-03-31T06:24:56.498900 #1]  INFO -- : Instrumentation: OpenTelemetry::Instrumentation::ActiveRecord was successfully installed with the following options {}
myapp  | I, [2023-03-31T06:24:56.499400 #1]  INFO -- : Instrumentation: OpenTelemetry::Instrumentation::ActionView was successfully installed with the following options {:disallowed_notification_payload_keys=>[], :notification_payload_transform=>nil}
myapp  | W, [2023-03-31T06:24:56.499417 #1]  WARN -- : Instrumentation: OpenTelemetry::Instrumentation::AwsSdk failed to install
myapp  | W, [2023-03-31T06:24:56.499426 #1]  WARN -- : Instrumentation: OpenTelemetry::Instrumentation::Bunny failed to install
myapp  | W, [2023-03-31T06:24:56.499437 #1]  WARN -- : Instrumentation: OpenTelemetry::Instrumentation::LMDB failed to install
myapp  | W, [2023-03-31T06:24:56.499445 #1]  WARN -- : Instrumentation: OpenTelemetry::Instrumentation::HTTP failed to install
myapp  | W, [2023-03-31T06:24:56.499452 #1]  WARN -- : Instrumentation: OpenTelemetry::Instrumentation::Koala failed to install
myapp  | W, [2023-03-31T06:24:56.499459 #1]  WARN -- : Instrumentation: OpenTelemetry::Instrumentation::ActiveModelSerializers failed to install
myapp  | I, [2023-03-31T06:24:56.499879 #1]  INFO -- : Instrumentation: OpenTelemetry::Instrumentation::ConcurrentRuby was successfully installed with the following options {}
myapp  | W, [2023-03-31T06:24:56.499895 #1]  WARN -- : Instrumentation: OpenTelemetry::Instrumentation::Dalli failed to install
myapp  | W, [2023-03-31T06:24:56.499903 #1]  WARN -- : Instrumentation: OpenTelemetry::Instrumentation::DelayedJob failed to install
myapp  | W, [2023-03-31T06:24:56.499911 #1]  WARN -- : Instrumentation: OpenTelemetry::Instrumentation::Ethon failed to install
myapp  | W, [2023-03-31T06:24:56.499934 #1]  WARN -- : Instrumentation: OpenTelemetry::Instrumentation::Excon failed to install
myapp  | W, [2023-03-31T06:24:56.499945 #1]  WARN -- : Instrumentation: OpenTelemetry::Instrumentation::Faraday failed to install
myapp  | W, [2023-03-31T06:24:56.499952 #1]  WARN -- : Instrumentation: OpenTelemetry::Instrumentation::GraphQL failed to install
myapp  | W, [2023-03-31T06:24:56.499959 #1]  WARN -- : Instrumentation: OpenTelemetry::Instrumentation::HttpClient failed to install
myapp  | W, [2023-03-31T06:24:56.499969 #1]  WARN -- : Instrumentation: OpenTelemetry::Instrumentation::Mongo failed to install
myapp  | W, [2023-03-31T06:24:56.499976 #1]  WARN -- : Instrumentation: OpenTelemetry::Instrumentation::Mysql2 failed to install
myapp  | I, [2023-03-31T06:24:56.500488 #1]  INFO -- : Instrumentation: OpenTelemetry::Instrumentation::Net::HTTP was successfully installed with the following options {:untraced_hosts=>[]}
myapp  | I, [2023-03-31T06:24:56.501739 #1]  INFO -- : Instrumentation: OpenTelemetry::Instrumentation::PG was successfully installed with the following options {:peer_service=>nil, :db_statement=>:include}
myapp  | W, [2023-03-31T06:24:56.501754 #1]  WARN -- : Instrumentation: OpenTelemetry::Instrumentation::Que failed to install
myapp  | W, [2023-03-31T06:24:56.501761 #1]  WARN -- : Instrumentation: OpenTelemetry::Instrumentation::Racecar failed to install
myapp  | I, [2023-03-31T06:24:56.501785 #1]  INFO -- : Instrumentation: OpenTelemetry::Instrumentation::Rails was successfully installed with the following options {}
myapp  | W, [2023-03-31T06:24:56.501794 #1]  WARN -- : Instrumentation: OpenTelemetry::Instrumentation::Rake failed to install
myapp  | W, [2023-03-31T06:24:56.501801 #1]  WARN -- : Instrumentation: OpenTelemetry::Instrumentation::Rdkafka failed to install
myapp  | W, [2023-03-31T06:24:56.501810 #1]  WARN -- : Instrumentation: OpenTelemetry::Instrumentation::Redis failed to install
myapp  | W, [2023-03-31T06:24:56.501817 #1]  WARN -- : Instrumentation: OpenTelemetry::Instrumentation::RestClient failed to install
myapp  | W, [2023-03-31T06:24:56.501824 #1]  WARN -- : Instrumentation: OpenTelemetry::Instrumentation::Resque failed to install
myapp  | W, [2023-03-31T06:24:56.501833 #1]  WARN -- : Instrumentation: OpenTelemetry::Instrumentation::RubyKafka failed to install
myapp  | W, [2023-03-31T06:24:56.501840 #1]  WARN -- : Instrumentation: OpenTelemetry::Instrumentation::Sidekiq failed to install
myapp  | W, [2023-03-31T06:24:56.501847 #1]  WARN -- : Instrumentation: OpenTelemetry::Instrumentation::Sinatra failed to install
myapp  | {"level":"UNKNOWN","time":"2023-03-31T06:24:56.610+00:00","msg":"Puma starting in single mode...","trace_id":"00000000000000000000000000000000","span_id":"0000000000000000","trace_flags":"00","node_id":"e18b8780-a516-4f60-91f7-cc341cac7850","progname":"rails-otel"}
myapp  |
myapp  | {"level":"UNKNOWN","time":"2023-03-31T06:24:56.610+00:00","msg":"Puma version: 5.6.5 (ruby 3.2.1-p31) (\"Birdie's Version\")","trace_id":"00000000000000000000000000000000","span_id":"0000000000000000","trace_flags":"00","node_id":"e18b8780-a516-4f60-91f7-cc341cac7850","progname":"rails-otel"}
myapp  |
myapp  | {"level":"UNKNOWN","time":"2023-03-31T06:24:56.610+00:00","msg":"Min threads: 5","trace_id":"00000000000000000000000000000000","span_id":"0000000000000000","trace_flags":"00","node_id":"e18b8780-a516-4f60-91f7-cc341cac7850","progname":"rails-otel"}
myapp  |
myapp  | {"level":"UNKNOWN","time":"2023-03-31T06:24:56.610+00:00","msg":"Max threads: 5","trace_id":"00000000000000000000000000000000","span_id":"0000000000000000","trace_flags":"00","node_id":"e18b8780-a516-4f60-91f7-cc341cac7850","progname":"rails-otel"}
myapp  |
myapp  | {"level":"UNKNOWN","time":"2023-03-31T06:24:56.610+00:00","msg":"Environment: development","trace_id":"00000000000000000000000000000000","span_id":"0000000000000000","trace_flags":"00","node_id":"e18b8780-a516-4f60-91f7-cc341cac7850","progname":"rails-otel"}
myapp  |
myapp  | {"level":"UNKNOWN","time":"2023-03-31T06:24:56.610+00:00","msg":"PID: 1","trace_id":"00000000000000000000000000000000","span_id":"0000000000000000","trace_flags":"00","node_id":"e18b8780-a516-4f60-91f7-cc341cac7850","progname":"rails-otel"}
myapp  |
myapp  | {"level":"UNKNOWN","time":"2023-03-31T06:24:56.610+00:00","msg":"Listening on http://0.0.0.0:3000","trace_id":"00000000000000000000000000000000","span_id":"0000000000000000","trace_flags":"00","node_id":"e18b8780-a516-4f60-91f7-cc341cac7850","progname":"rails-otel"}
myapp  |
myapp  | {"level":"UNKNOWN","time":"2023-03-31T06:24:56.610+00:00","msg":"Use Ctrl-C to stop","trace_id":"00000000000000000000000000000000","span_id":"0000000000000000","trace_flags":"00","node_id":"e18b8780-a516-4f60-91f7-cc341cac7850","progname":"rails-otel"}
myapp  |
Changes on this section can be seen at this commit 2c5eb6f.
Duck-typing the Ruby::Logger #
In previous sub-section, we use Ruby::Logger as the OpenTelemetry SDK Logger. Since we use Ruby 3.2.1 in Gemfile, it should refer to this Ruby Logger.
So, we can actually duck-type the Ruby logger formatter class to format our log into JSON, by defining class and method argument same as in this source or in this commit.
To do that, create file config/logger_json.rb:
class Logger::Formatter
    def call(severity, time, program_name, message)
      json_log = {
        level: severity,
        time: time,
        msg: message,
        trace_id: '00000000000000000000000000000000',
        span_id: '0000000000000000',
        trace_flags: '00',
        node_id: RAILS_NODE_ID,
        progname: program_name || PROGRAM_NAME,
      }.to_json

      STDOUT.puts(json_log)
    end
end
And in file config/boot.rb, add:
require_relative "logger_json"
Now, if you recreate the Docker container, it will show all JSON log.
Changes on this section can be seen at this commit 52d0dca.
Duck-typing the Ruby ActiveRecord Logger #
References of this section:
If we access the URL
http://localhost:3000/list-vouchers?token={your-token} we still get the non-JSON formatted log. We need to duck typing the ActiveRecord::Logger too.
Write this file config/logger_active_record_json.rb:
require 'securerandom'

# Class ActiveSupport::Logger will duck-type the original ActiveSupport::Logger class
class ActiveSupport::Logger

  def initialize(*args)
    super(*args)
  end

  # format_message will override the method format_message on Ruby class Logger here:
  # https://github.com/ruby/logger/blob/4e8d9e27fd3b8f916cd3b370b97359f67e02c4bb/lib/logger.rb#L742-L744
  # 4e8d9e2 is the commit release of version https://github.com/ruby/logger/releases/tag/v1.5.3
  #
  # This because ActiveSupport::Logger duck-typing (extends) class Logger as seen here
  # https://github.com/rails/rails/blob/7c70791470fc517deb7c640bead9f1b47efb5539/activesupport/lib/active_support/logger.rb#L8
  # 7c70791 is commit id on release tag https://github.com/rails/rails/releases/tag/v7.0.4.2
  #
  # format_message should return void, so we do return with no arguments
  # We print it as JSON.
  def format_message(severity, timestamp, progname, msg)
    # prepare log and print it
    log = format_json(severity, timestamp, progname, msg, nil)
    STDOUT.puts(log)
    return
  end

  # format_json will format *args as JSON structured format.
  # This function will return JSON, and not print it.
  # The format MUST the same as format_message except this has "attributes" key.
  # In Ruby, you can use the splat operator * to define a variadic argument,
  # which allows a method to accept an arbitrary number of arguments. To add type checking to a variadic argument,
  # you can use the syntax argname : Type*.
  def format_json(severity, time, progname, msg, data, *args)
    current_span = OpenTelemetry::Trace.current_span
    trace_id = current_span.context.trace_id
    hex_trace_id = trace_id.unpack1('H*')

    span_id = current_span.context.span_id
    hex_span_id = span_id.unpack1('H*')

    attributes = []
    args.each_with_index do |arg, index|
      # The next argument can be anything.
      attributes.push(arg)
    end

    # prepare log and return it
    log = {
      level: severity,
      time: time,
      msg: msg,
      trace_id: hex_trace_id,
      span_id: hex_span_id,
      trace_flags: '00',
      node_id: RAILS_NODE_ID,
      progname: progname || PROGRAM_NAME,
    }

    # Get request id from Thread context.
    # It must not be empty since we should always set it in the first middleware.
    if !Thread.current[:request_id].nil? && !Thread.current[:request_id].empty?
      log[:request_id] = Thread.current[:request_id]
    end

    # Check if a variable is a Hash using instance_of?
    # If data is not a Hash, it will become attributes.
    if !data.nil? && !data.empty?
      if data.instance_of?(Hash)
        log[:data] = data
      else
        attributes.push(data)
      end
    end

    if !attributes.nil? && !attributes.empty?
      log[:attributes] = attributes
    end

    return log.to_json
  end

  # debug_ctx will format the arguments as JSON and the print it using STDOUT.puts
  # This uses block (debug{}) instead of function call (debug()) to make it memory efficient.
  # https://stackoverflow.com/a/30144402
  # Since the original Ruby ::Logger has debug, info, warn, error, fatal and unknown logger,
  # we add suffixes _ctx which take multiple arguments and the first argument must String which is the message log.
  # We get the program name using self as it access the parent class:
  # https://github.com/ruby/logger/blob/4e8d9e27fd3b8f916cd3b370b97359f67e02c4bb/lib/logger.rb#L420-L421
  def debug_ctx(msg, data, *args)
    self.debug do
      log = format_json("DEBUG", Time.now, self.progname, msg, data, *args)
      STDOUT.puts(log)
      return ""
    end
  end

  def info_ctx(msg, data, *args)
    self.info do
      log = format_json("INFO", Time.now, self.progname, msg, data, *args)
      STDOUT.puts(log)
      return ""
    end
  end

  def warn_ctx(msg, data)
    self.warn do
      log = format_json("WARN", Time.now, self.progname, msg, data, *args)
      STDOUT.puts(log)
      return ""
    end
  end

  def error_ctx(msg, data)
    self.error do
      log = format_json("ERROR", Time.now, self.progname, msg, data, *args)
      STDOUT.puts(log)
      return ""
    end
  end

  def fatal_ctx(msg, data)
    self.fatal do
      log = format_json("FATAL", Time.now, self.progname, msg, data, *args)
      STDOUT.puts(log)
      return ""
    end
  end

  def unknown_ctx(msg, data, *args)
    self.debug do
      log = format_json("UNKNOWN", Time.now, self.progname, msg, data)
      STDOUT.puts(log)
      return ""
    end
  end

end # end of class Json

MyLogger = ActiveSupport::Logger.new(STDOUT)
Then import that file from config/boot.rb, add:
require_relative "logger_active_record_json"
Restart the server and now access our endpoint http://localhost:3000/list-vouchers?token={your-token}. Now, our log must show all log in JSON format output:
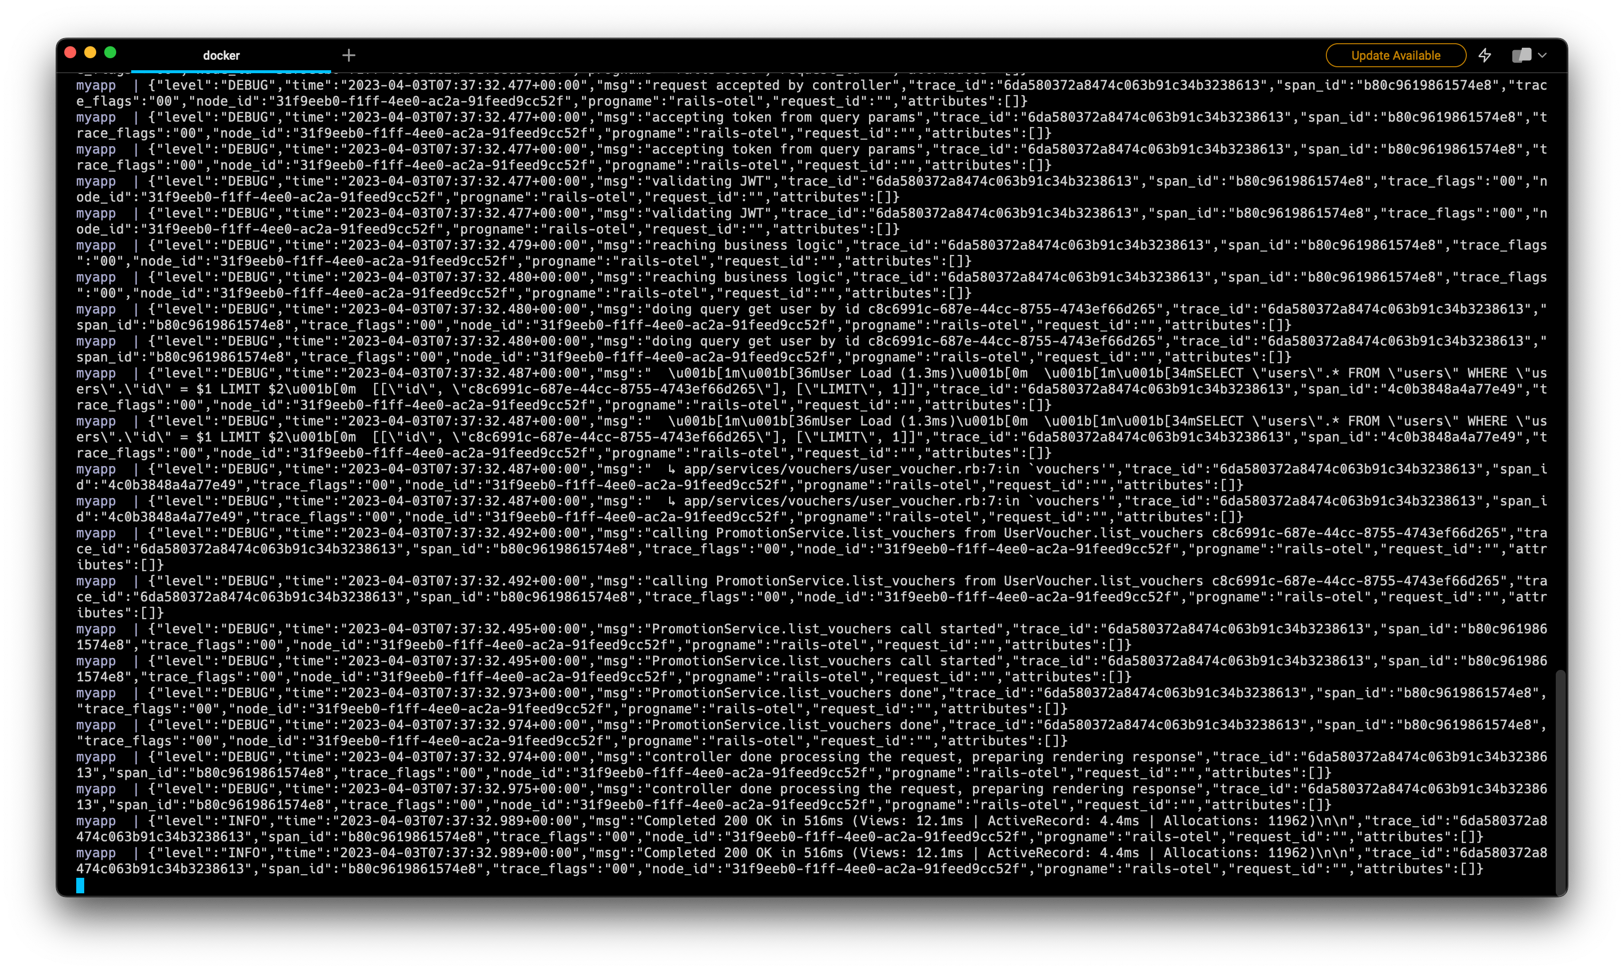
Rails Logger After Duck-Typing ActiveRecord::Logger
myapp  | {"level":"UNKNOWN","time":"2023-04-03T09:39:40.328+00:00","msg":"Booting Puma","trace_id":"00000000000000000000000000000000","span_id":"0000000000000000","trace_flags":"00","node_id":"ac8d3e07-387e-4287-ac2f-4f9414c5504f","progname":"rails-otel"}
myapp  | {"level":"UNKNOWN","time":"2023-04-03T09:39:40.328+00:00","msg":"Rails 7.0.4.2 application starting in development ","trace_id":"00000000000000000000000000000000","span_id":"0000000000000000","trace_flags":"00","node_id":"ac8d3e07-387e-4287-ac2f-4f9414c5504f","progname":"rails-otel"}
myapp  | {"level":"UNKNOWN","time":"2023-04-03T09:39:40.328+00:00","msg":"Run `bin/rails server --help` for more startup options","trace_id":"00000000000000000000000000000000","span_id":"0000000000000000","trace_flags":"00","node_id":"ac8d3e07-387e-4287-ac2f-4f9414c5504f","progname":"rails-otel"}
myapp  | {"level":"WARN","time":"2023-04-03T09:39:40.440+00:00","msg":"Instrumentation: OpenTelemetry::Instrumentation::Trilogy failed to install","trace_id":"00000000000000000000000000000000","span_id":"0000000000000000","trace_flags":"00","node_id":"ac8d3e07-387e-4287-ac2f-4f9414c5504f","progname":"rails-otel"}
myapp  | {"level":"INFO","time":"2023-04-03T09:39:40.441+00:00","msg":"Instrumentation: OpenTelemetry::Instrumentation::ActiveSupport was successfully installed with the following options {}","trace_id":"00000000000000000000000000000000","span_id":"0000000000000000","trace_flags":"00","node_id":"ac8d3e07-387e-4287-ac2f-4f9414c5504f","progname":"rails-otel"}
myapp  | {"level":"INFO","time":"2023-04-03T09:39:40.442+00:00","msg":"Instrumentation: OpenTelemetry::Instrumentation::Rack was successfully installed with the following options {:allowed_request_headers=\u003e[], :allowed_response_headers=\u003e[], :application=\u003enil, :record_frontend_span=\u003efalse, :retain_middleware_names=\u003efalse, :untraced_endpoints=\u003e[], :url_quantization=\u003enil, :untraced_requests=\u003enil, :response_propagators=\u003e[]}","trace_id":"00000000000000000000000000000000","span_id":"0000000000000000","trace_flags":"00","node_id":"ac8d3e07-387e-4287-ac2f-4f9414c5504f","progname":"rails-otel"}
myapp  | {"level":"INFO","time":"2023-04-03T09:39:40.445+00:00","msg":"Instrumentation: OpenTelemetry::Instrumentation::ActionPack was successfully installed with the following options {}","trace_id":"00000000000000000000000000000000","span_id":"0000000000000000","trace_flags":"00","node_id":"ac8d3e07-387e-4287-ac2f-4f9414c5504f","progname":"rails-otel"}
myapp  | {"level":"INFO","time":"2023-04-03T09:39:40.455+00:00","msg":"Instrumentation: OpenTelemetry::Instrumentation::ActiveJob was successfully installed with the following options {:propagation_style=\u003e:link, :force_flush=\u003efalse, :span_naming=\u003e:queue}","trace_id":"00000000000000000000000000000000","span_id":"0000000000000000","trace_flags":"00","node_id":"ac8d3e07-387e-4287-ac2f-4f9414c5504f","progname":"rails-otel"}
myapp  | {"level":"INFO","time":"2023-04-03T09:39:40.558+00:00","msg":"Instrumentation: OpenTelemetry::Instrumentation::ActiveRecord was successfully installed with the following options {}","trace_id":"00000000000000000000000000000000","span_id":"0000000000000000","trace_flags":"00","node_id":"ac8d3e07-387e-4287-ac2f-4f9414c5504f","progname":"rails-otel"}
myapp  | {"level":"INFO","time":"2023-04-03T09:39:40.559+00:00","msg":"Instrumentation: OpenTelemetry::Instrumentation::ActionView was successfully installed with the following options {:disallowed_notification_payload_keys=\u003e[], :notification_payload_transform=\u003enil}","trace_id":"00000000000000000000000000000000","span_id":"0000000000000000","trace_flags":"00","node_id":"ac8d3e07-387e-4287-ac2f-4f9414c5504f","progname":"rails-otel"}
myapp  | {"level":"WARN","time":"2023-04-03T09:39:40.559+00:00","msg":"Instrumentation: OpenTelemetry::Instrumentation::AwsSdk failed to install","trace_id":"00000000000000000000000000000000","span_id":"0000000000000000","trace_flags":"00","node_id":"ac8d3e07-387e-4287-ac2f-4f9414c5504f","progname":"rails-otel"}
myapp  | {"level":"WARN","time":"2023-04-03T09:39:40.559+00:00","msg":"Instrumentation: OpenTelemetry::Instrumentation::Bunny failed to install","trace_id":"00000000000000000000000000000000","span_id":"0000000000000000","trace_flags":"00","node_id":"ac8d3e07-387e-4287-ac2f-4f9414c5504f","progname":"rails-otel"}
myapp  | {"level":"WARN","time":"2023-04-03T09:39:40.559+00:00","msg":"Instrumentation: OpenTelemetry::Instrumentation::LMDB failed to install","trace_id":"00000000000000000000000000000000","span_id":"0000000000000000","trace_flags":"00","node_id":"ac8d3e07-387e-4287-ac2f-4f9414c5504f","progname":"rails-otel"}
myapp  | {"level":"WARN","time":"2023-04-03T09:39:40.559+00:00","msg":"Instrumentation: OpenTelemetry::Instrumentation::HTTP failed to install","trace_id":"00000000000000000000000000000000","span_id":"0000000000000000","trace_flags":"00","node_id":"ac8d3e07-387e-4287-ac2f-4f9414c5504f","progname":"rails-otel"}
myapp  | {"level":"WARN","time":"2023-04-03T09:39:40.559+00:00","msg":"Instrumentation: OpenTelemetry::Instrumentation::Koala failed to install","trace_id":"00000000000000000000000000000000","span_id":"0000000000000000","trace_flags":"00","node_id":"ac8d3e07-387e-4287-ac2f-4f9414c5504f","progname":"rails-otel"}
myapp  | {"level":"WARN","time":"2023-04-03T09:39:40.559+00:00","msg":"Instrumentation: OpenTelemetry::Instrumentation::ActiveModelSerializers failed to install","trace_id":"00000000000000000000000000000000","span_id":"0000000000000000","trace_flags":"00","node_id":"ac8d3e07-387e-4287-ac2f-4f9414c5504f","progname":"rails-otel"}
myapp  | {"level":"INFO","time":"2023-04-03T09:39:40.560+00:00","msg":"Instrumentation: OpenTelemetry::Instrumentation::ConcurrentRuby was successfully installed with the following options {}","trace_id":"00000000000000000000000000000000","span_id":"0000000000000000","trace_flags":"00","node_id":"ac8d3e07-387e-4287-ac2f-4f9414c5504f","progname":"rails-otel"}
myapp  | {"level":"WARN","time":"2023-04-03T09:39:40.560+00:00","msg":"Instrumentation: OpenTelemetry::Instrumentation::Dalli failed to install","trace_id":"00000000000000000000000000000000","span_id":"0000000000000000","trace_flags":"00","node_id":"ac8d3e07-387e-4287-ac2f-4f9414c5504f","progname":"rails-otel"}
myapp  | {"level":"WARN","time":"2023-04-03T09:39:40.560+00:00","msg":"Instrumentation: OpenTelemetry::Instrumentation::DelayedJob failed to install","trace_id":"00000000000000000000000000000000","span_id":"0000000000000000","trace_flags":"00","node_id":"ac8d3e07-387e-4287-ac2f-4f9414c5504f","progname":"rails-otel"}
myapp  | {"level":"WARN","time":"2023-04-03T09:39:40.560+00:00","msg":"Instrumentation: OpenTelemetry::Instrumentation::Ethon failed to install","trace_id":"00000000000000000000000000000000","span_id":"0000000000000000","trace_flags":"00","node_id":"ac8d3e07-387e-4287-ac2f-4f9414c5504f","progname":"rails-otel"}
myapp  | {"level":"WARN","time":"2023-04-03T09:39:40.560+00:00","msg":"Instrumentation: OpenTelemetry::Instrumentation::Excon failed to install","trace_id":"00000000000000000000000000000000","span_id":"0000000000000000","trace_flags":"00","node_id":"ac8d3e07-387e-4287-ac2f-4f9414c5504f","progname":"rails-otel"}
myapp  | {"level":"WARN","time":"2023-04-03T09:39:40.560+00:00","msg":"Instrumentation: OpenTelemetry::Instrumentation::Faraday failed to install","trace_id":"00000000000000000000000000000000","span_id":"0000000000000000","trace_flags":"00","node_id":"ac8d3e07-387e-4287-ac2f-4f9414c5504f","progname":"rails-otel"}
myapp  | {"level":"WARN","time":"2023-04-03T09:39:40.560+00:00","msg":"Instrumentation: OpenTelemetry::Instrumentation::GraphQL failed to install","trace_id":"00000000000000000000000000000000","span_id":"0000000000000000","trace_flags":"00","node_id":"ac8d3e07-387e-4287-ac2f-4f9414c5504f","progname":"rails-otel"}
myapp  | {"level":"WARN","time":"2023-04-03T09:39:40.560+00:00","msg":"Instrumentation: OpenTelemetry::Instrumentation::HttpClient failed to install","trace_id":"00000000000000000000000000000000","span_id":"0000000000000000","trace_flags":"00","node_id":"ac8d3e07-387e-4287-ac2f-4f9414c5504f","progname":"rails-otel"}
myapp  | {"level":"WARN","time":"2023-04-03T09:39:40.560+00:00","msg":"Instrumentation: OpenTelemetry::Instrumentation::Mongo failed to install","trace_id":"00000000000000000000000000000000","span_id":"0000000000000000","trace_flags":"00","node_id":"ac8d3e07-387e-4287-ac2f-4f9414c5504f","progname":"rails-otel"}
myapp  | {"level":"WARN","time":"2023-04-03T09:39:40.560+00:00","msg":"Instrumentation: OpenTelemetry::Instrumentation::Mysql2 failed to install","trace_id":"00000000000000000000000000000000","span_id":"0000000000000000","trace_flags":"00","node_id":"ac8d3e07-387e-4287-ac2f-4f9414c5504f","progname":"rails-otel"}
myapp  | {"level":"INFO","time":"2023-04-03T09:39:40.561+00:00","msg":"Instrumentation: OpenTelemetry::Instrumentation::Net::HTTP was successfully installed with the following options {:untraced_hosts=\u003e[]}","trace_id":"00000000000000000000000000000000","span_id":"0000000000000000","trace_flags":"00","node_id":"ac8d3e07-387e-4287-ac2f-4f9414c5504f","progname":"rails-otel"}
myapp  | {"level":"INFO","time":"2023-04-03T09:39:40.562+00:00","msg":"Instrumentation: OpenTelemetry::Instrumentation::PG was successfully installed with the following options {:peer_service=\u003enil, :db_statement=\u003e:include}","trace_id":"00000000000000000000000000000000","span_id":"0000000000000000","trace_flags":"00","node_id":"ac8d3e07-387e-4287-ac2f-4f9414c5504f","progname":"rails-otel"}
myapp  | {"level":"WARN","time":"2023-04-03T09:39:40.562+00:00","msg":"Instrumentation: OpenTelemetry::Instrumentation::Que failed to install","trace_id":"00000000000000000000000000000000","span_id":"0000000000000000","trace_flags":"00","node_id":"ac8d3e07-387e-4287-ac2f-4f9414c5504f","progname":"rails-otel"}
myapp  | {"level":"WARN","time":"2023-04-03T09:39:40.562+00:00","msg":"Instrumentation: OpenTelemetry::Instrumentation::Racecar failed to install","trace_id":"00000000000000000000000000000000","span_id":"0000000000000000","trace_flags":"00","node_id":"ac8d3e07-387e-4287-ac2f-4f9414c5504f","progname":"rails-otel"}
myapp  | {"level":"INFO","time":"2023-04-03T09:39:40.562+00:00","msg":"Instrumentation: OpenTelemetry::Instrumentation::Rails was successfully installed with the following options {}","trace_id":"00000000000000000000000000000000","span_id":"0000000000000000","trace_flags":"00","node_id":"ac8d3e07-387e-4287-ac2f-4f9414c5504f","progname":"rails-otel"}
myapp  | {"level":"WARN","time":"2023-04-03T09:39:40.562+00:00","msg":"Instrumentation: OpenTelemetry::Instrumentation::Rake failed to install","trace_id":"00000000000000000000000000000000","span_id":"0000000000000000","trace_flags":"00","node_id":"ac8d3e07-387e-4287-ac2f-4f9414c5504f","progname":"rails-otel"}
myapp  | {"level":"WARN","time":"2023-04-03T09:39:40.562+00:00","msg":"Instrumentation: OpenTelemetry::Instrumentation::Rdkafka failed to install","trace_id":"00000000000000000000000000000000","span_id":"0000000000000000","trace_flags":"00","node_id":"ac8d3e07-387e-4287-ac2f-4f9414c5504f","progname":"rails-otel"}
myapp  | {"level":"WARN","time":"2023-04-03T09:39:40.563+00:00","msg":"Instrumentation: OpenTelemetry::Instrumentation::Redis failed to install","trace_id":"00000000000000000000000000000000","span_id":"0000000000000000","trace_flags":"00","node_id":"ac8d3e07-387e-4287-ac2f-4f9414c5504f","progname":"rails-otel"}
myapp  | {"level":"WARN","time":"2023-04-03T09:39:40.563+00:00","msg":"Instrumentation: OpenTelemetry::Instrumentation::RestClient failed to install","trace_id":"00000000000000000000000000000000","span_id":"0000000000000000","trace_flags":"00","node_id":"ac8d3e07-387e-4287-ac2f-4f9414c5504f","progname":"rails-otel"}
myapp  | {"level":"WARN","time":"2023-04-03T09:39:40.563+00:00","msg":"Instrumentation: OpenTelemetry::Instrumentation::Resque failed to install","trace_id":"00000000000000000000000000000000","span_id":"0000000000000000","trace_flags":"00","node_id":"ac8d3e07-387e-4287-ac2f-4f9414c5504f","progname":"rails-otel"}
myapp  | {"level":"WARN","time":"2023-04-03T09:39:40.563+00:00","msg":"Instrumentation: OpenTelemetry::Instrumentation::RubyKafka failed to install","trace_id":"00000000000000000000000000000000","span_id":"0000000000000000","trace_flags":"00","node_id":"ac8d3e07-387e-4287-ac2f-4f9414c5504f","progname":"rails-otel"}
myapp  | {"level":"WARN","time":"2023-04-03T09:39:40.563+00:00","msg":"Instrumentation: OpenTelemetry::Instrumentation::Sidekiq failed to install","trace_id":"00000000000000000000000000000000","span_id":"0000000000000000","trace_flags":"00","node_id":"ac8d3e07-387e-4287-ac2f-4f9414c5504f","progname":"rails-otel"}
myapp  | {"level":"WARN","time":"2023-04-03T09:39:40.563+00:00","msg":"Instrumentation: OpenTelemetry::Instrumentation::Sinatra failed to install","trace_id":"00000000000000000000000000000000","span_id":"0000000000000000","trace_flags":"00","node_id":"ac8d3e07-387e-4287-ac2f-4f9414c5504f","progname":"rails-otel"}
myapp  | {"level":"UNKNOWN","time":"2023-04-03T09:39:40.694+00:00","msg":"Puma starting in single mode...","trace_id":"00000000000000000000000000000000","span_id":"0000000000000000","trace_flags":"00","node_id":"ac8d3e07-387e-4287-ac2f-4f9414c5504f","progname":"rails-otel"}
myapp  |
myapp  | {"level":"UNKNOWN","time":"2023-04-03T09:39:40.694+00:00","msg":"Puma version: 5.6.5 (ruby 3.2.1-p31) (\"Birdie's Version\")","trace_id":"00000000000000000000000000000000","span_id":"0000000000000000","trace_flags":"00","node_id":"ac8d3e07-387e-4287-ac2f-4f9414c5504f","progname":"rails-otel"}
myapp  |
myapp  | {"level":"UNKNOWN","time":"2023-04-03T09:39:40.694+00:00","msg":"Min threads: 5","trace_id":"00000000000000000000000000000000","span_id":"0000000000000000","trace_flags":"00","node_id":"ac8d3e07-387e-4287-ac2f-4f9414c5504f","progname":"rails-otel"}
myapp  |
myapp  | {"level":"UNKNOWN","time":"2023-04-03T09:39:40.694+00:00","msg":"Max threads: 5","trace_id":"00000000000000000000000000000000","span_id":"0000000000000000","trace_flags":"00","node_id":"ac8d3e07-387e-4287-ac2f-4f9414c5504f","progname":"rails-otel"}
myapp  |
myapp  | {"level":"UNKNOWN","time":"2023-04-03T09:39:40.694+00:00","msg":"Environment: development","trace_id":"00000000000000000000000000000000","span_id":"0000000000000000","trace_flags":"00","node_id":"ac8d3e07-387e-4287-ac2f-4f9414c5504f","progname":"rails-otel"}
myapp  |
myapp  | {"level":"UNKNOWN","time":"2023-04-03T09:39:40.694+00:00","msg":"PID: 1","trace_id":"00000000000000000000000000000000","span_id":"0000000000000000","trace_flags":"00","node_id":"ac8d3e07-387e-4287-ac2f-4f9414c5504f","progname":"rails-otel"}
myapp  |
myapp  | {"level":"UNKNOWN","time":"2023-04-03T09:39:40.694+00:00","msg":"Listening on http://0.0.0.0:3000","trace_id":"00000000000000000000000000000000","span_id":"0000000000000000","trace_flags":"00","node_id":"ac8d3e07-387e-4287-ac2f-4f9414c5504f","progname":"rails-otel"}
myapp  |
myapp  | {"level":"UNKNOWN","time":"2023-04-03T09:39:40.694+00:00","msg":"Use Ctrl-C to stop","trace_id":"00000000000000000000000000000000","span_id":"0000000000000000","trace_flags":"00","node_id":"ac8d3e07-387e-4287-ac2f-4f9414c5504f","progname":"rails-otel"}
myapp  |
myapp  | {"level":"INFO","time":"2023-04-03T09:39:51.537+00:00","msg":"Started GET \"/list-vouchers?token=[FILTERED]\" for 172.19.0.1 at 2023-04-03 09:39:51 +0000","trace_id":"4862c816e54cf50f3d0147068a88ccc7","span_id":"872682563d412c74","trace_flags":"00","node_id":"ac8d3e07-387e-4287-ac2f-4f9414c5504f","progname":"rails-otel"}
myapp  | {"level":"INFO","time":"2023-04-03T09:39:51.537+00:00","msg":"Started GET \"/list-vouchers?token=[FILTERED]\" for 172.19.0.1 at 2023-04-03 09:39:51 +0000","trace_id":"4862c816e54cf50f3d0147068a88ccc7","span_id":"872682563d412c74","trace_flags":"00","node_id":"ac8d3e07-387e-4287-ac2f-4f9414c5504f","progname":"rails-otel"}
myapp  | {"level":"INFO","time":"2023-04-03T09:39:51.538+00:00","msg":"Cannot render console from 172.19.0.1! Allowed networks: 127.0.0.0/127.255.255.255, ::1","trace_id":"4862c816e54cf50f3d0147068a88ccc7","span_id":"872682563d412c74","trace_flags":"00","node_id":"ac8d3e07-387e-4287-ac2f-4f9414c5504f","progname":"rails-otel"}
myapp  | {"level":"INFO","time":"2023-04-03T09:39:51.539+00:00","msg":"Cannot render console from 172.19.0.1! Allowed networks: 127.0.0.0/127.255.255.255, ::1","trace_id":"4862c816e54cf50f3d0147068a88ccc7","span_id":"872682563d412c74","trace_flags":"00","node_id":"ac8d3e07-387e-4287-ac2f-4f9414c5504f","progname":"rails-otel"}
myapp  | {"level":"DEBUG","time":"2023-04-03T09:39:51.661+00:00","msg":"  \u001b[1m\u001b[36mActiveRecord::SchemaMigration Pluck (3.4ms)\u001b[0m  \u001b[1m\u001b[34mSELECT \"schema_migrations\".\"version\" FROM \"schema_migrations\" ORDER BY \"schema_migrations\".\"version\" ASC\u001b[0m","trace_id":"4862c816e54cf50f3d0147068a88ccc7","span_id":"872682563d412c74","trace_flags":"00","node_id":"ac8d3e07-387e-4287-ac2f-4f9414c5504f","progname":"rails-otel"}
myapp  | {"level":"DEBUG","time":"2023-04-03T09:39:51.661+00:00","msg":"  \u001b[1m\u001b[36mActiveRecord::SchemaMigration Pluck (3.4ms)\u001b[0m  \u001b[1m\u001b[34mSELECT \"schema_migrations\".\"version\" FROM \"schema_migrations\" ORDER BY \"schema_migrations\".\"version\" ASC\u001b[0m","trace_id":"4862c816e54cf50f3d0147068a88ccc7","span_id":"872682563d412c74","trace_flags":"00","node_id":"ac8d3e07-387e-4287-ac2f-4f9414c5504f","progname":"rails-otel"}
myapp  | {"level":"INFO","time":"2023-04-03T09:39:51.690+00:00","msg":"Processing by UserPromotionController#list_vouchers as HTML","trace_id":"4862c816e54cf50f3d0147068a88ccc7","span_id":"872682563d412c74","trace_flags":"00","node_id":"ac8d3e07-387e-4287-ac2f-4f9414c5504f","progname":"rails-otel"}
myapp  | {"level":"INFO","time":"2023-04-03T09:39:51.690+00:00","msg":"Processing by UserPromotionController#list_vouchers as HTML","trace_id":"4862c816e54cf50f3d0147068a88ccc7","span_id":"872682563d412c74","trace_flags":"00","node_id":"ac8d3e07-387e-4287-ac2f-4f9414c5504f","progname":"rails-otel"}
myapp  | {"level":"INFO","time":"2023-04-03T09:39:51.690+00:00","msg":"  Parameters: {\"token\"=\u003e\"[FILTERED]\"}","trace_id":"4862c816e54cf50f3d0147068a88ccc7","span_id":"872682563d412c74","trace_flags":"00","node_id":"ac8d3e07-387e-4287-ac2f-4f9414c5504f","progname":"rails-otel"}
myapp  | {"level":"INFO","time":"2023-04-03T09:39:51.690+00:00","msg":"  Parameters: {\"token\"=\u003e\"[FILTERED]\"}","trace_id":"4862c816e54cf50f3d0147068a88ccc7","span_id":"872682563d412c74","trace_flags":"00","node_id":"ac8d3e07-387e-4287-ac2f-4f9414c5504f","progname":"rails-otel"}
myapp  | {"level":"DEBUG","time":"2023-04-03T09:39:51.694+00:00","msg":"request accepted by controller","trace_id":"4862c816e54cf50f3d0147068a88ccc7","span_id":"872682563d412c74","trace_flags":"00","node_id":"ac8d3e07-387e-4287-ac2f-4f9414c5504f","progname":"rails-otel"}
myapp  | {"level":"DEBUG","time":"2023-04-03T09:39:51.694+00:00","msg":"request accepted by controller","trace_id":"4862c816e54cf50f3d0147068a88ccc7","span_id":"872682563d412c74","trace_flags":"00","node_id":"ac8d3e07-387e-4287-ac2f-4f9414c5504f","progname":"rails-otel"}
myapp  | {"level":"DEBUG","time":"2023-04-03T09:39:51.694+00:00","msg":"accepting token from query params","trace_id":"4862c816e54cf50f3d0147068a88ccc7","span_id":"872682563d412c74","trace_flags":"00","node_id":"ac8d3e07-387e-4287-ac2f-4f9414c5504f","progname":"rails-otel"}
myapp  | {"level":"DEBUG","time":"2023-04-03T09:39:51.695+00:00","msg":"accepting token from query params","trace_id":"4862c816e54cf50f3d0147068a88ccc7","span_id":"872682563d412c74","trace_flags":"00","node_id":"ac8d3e07-387e-4287-ac2f-4f9414c5504f","progname":"rails-otel"}
myapp  | {"level":"DEBUG","time":"2023-04-03T09:39:51.695+00:00","msg":"validating JWT","trace_id":"4862c816e54cf50f3d0147068a88ccc7","span_id":"872682563d412c74","trace_flags":"00","node_id":"ac8d3e07-387e-4287-ac2f-4f9414c5504f","progname":"rails-otel"}
myapp  | {"level":"DEBUG","time":"2023-04-03T09:39:51.695+00:00","msg":"validating JWT","trace_id":"4862c816e54cf50f3d0147068a88ccc7","span_id":"872682563d412c74","trace_flags":"00","node_id":"ac8d3e07-387e-4287-ac2f-4f9414c5504f","progname":"rails-otel"}
myapp  | {"level":"DEBUG","time":"2023-04-03T09:39:51.697+00:00","msg":"reaching business logic","trace_id":"4862c816e54cf50f3d0147068a88ccc7","span_id":"872682563d412c74","trace_flags":"00","node_id":"ac8d3e07-387e-4287-ac2f-4f9414c5504f","progname":"rails-otel"}
myapp  | {"level":"DEBUG","time":"2023-04-03T09:39:51.697+00:00","msg":"reaching business logic","trace_id":"4862c816e54cf50f3d0147068a88ccc7","span_id":"872682563d412c74","trace_flags":"00","node_id":"ac8d3e07-387e-4287-ac2f-4f9414c5504f","progname":"rails-otel"}
myapp  | {"level":"DEBUG","time":"2023-04-03T09:39:51.697+00:00","msg":"doing query get user by id c8c6991c-687e-44cc-8755-4743ef66d265","trace_id":"4862c816e54cf50f3d0147068a88ccc7","span_id":"872682563d412c74","trace_flags":"00","node_id":"ac8d3e07-387e-4287-ac2f-4f9414c5504f","progname":"rails-otel"}
myapp  | {"level":"DEBUG","time":"2023-04-03T09:39:51.697+00:00","msg":"doing query get user by id c8c6991c-687e-44cc-8755-4743ef66d265","trace_id":"4862c816e54cf50f3d0147068a88ccc7","span_id":"872682563d412c74","trace_flags":"00","node_id":"ac8d3e07-387e-4287-ac2f-4f9414c5504f","progname":"rails-otel"}
myapp  | {"level":"DEBUG","time":"2023-04-03T09:39:51.706+00:00","msg":"  \u001b[1m\u001b[36mUser Load (1.5ms)\u001b[0m  \u001b[1m\u001b[34mSELECT \"users\".* FROM \"users\" WHERE \"users\".\"id\" = $1 LIMIT $2\u001b[0m  [[\"id\", \"c8c6991c-687e-44cc-8755-4743ef66d265\"], [\"LIMIT\", 1]]","trace_id":"4862c816e54cf50f3d0147068a88ccc7","span_id":"64b1c2051f3fdefa","trace_flags":"00","node_id":"ac8d3e07-387e-4287-ac2f-4f9414c5504f","progname":"rails-otel"}
myapp  | {"level":"DEBUG","time":"2023-04-03T09:39:51.706+00:00","msg":"  \u001b[1m\u001b[36mUser Load (1.5ms)\u001b[0m  \u001b[1m\u001b[34mSELECT \"users\".* FROM \"users\" WHERE \"users\".\"id\" = $1 LIMIT $2\u001b[0m  [[\"id\", \"c8c6991c-687e-44cc-8755-4743ef66d265\"], [\"LIMIT\", 1]]","trace_id":"4862c816e54cf50f3d0147068a88ccc7","span_id":"64b1c2051f3fdefa","trace_flags":"00","node_id":"ac8d3e07-387e-4287-ac2f-4f9414c5504f","progname":"rails-otel"}
myapp  | {"level":"DEBUG","time":"2023-04-03T09:39:51.707+00:00","msg":"  ↳ app/services/vouchers/user_voucher.rb:7:in `vouchers'","trace_id":"4862c816e54cf50f3d0147068a88ccc7","span_id":"64b1c2051f3fdefa","trace_flags":"00","node_id":"ac8d3e07-387e-4287-ac2f-4f9414c5504f","progname":"rails-otel"}
myapp  | {"level":"DEBUG","time":"2023-04-03T09:39:51.707+00:00","msg":"  ↳ app/services/vouchers/user_voucher.rb:7:in `vouchers'","trace_id":"4862c816e54cf50f3d0147068a88ccc7","span_id":"64b1c2051f3fdefa","trace_flags":"00","node_id":"ac8d3e07-387e-4287-ac2f-4f9414c5504f","progname":"rails-otel"}
myapp  | {"level":"DEBUG","time":"2023-04-03T09:39:51.713+00:00","msg":"calling PromotionService.list_vouchers from UserVoucher.list_vouchers c8c6991c-687e-44cc-8755-4743ef66d265","trace_id":"4862c816e54cf50f3d0147068a88ccc7","span_id":"872682563d412c74","trace_flags":"00","node_id":"ac8d3e07-387e-4287-ac2f-4f9414c5504f","progname":"rails-otel"}
myapp  | {"level":"DEBUG","time":"2023-04-03T09:39:51.713+00:00","msg":"calling PromotionService.list_vouchers from UserVoucher.list_vouchers c8c6991c-687e-44cc-8755-4743ef66d265","trace_id":"4862c816e54cf50f3d0147068a88ccc7","span_id":"872682563d412c74","trace_flags":"00","node_id":"ac8d3e07-387e-4287-ac2f-4f9414c5504f","progname":"rails-otel"}
myapp  | {"level":"DEBUG","time":"2023-04-03T09:39:51.715+00:00","msg":"PromotionService.list_vouchers call started","trace_id":"4862c816e54cf50f3d0147068a88ccc7","span_id":"872682563d412c74","trace_flags":"00","node_id":"ac8d3e07-387e-4287-ac2f-4f9414c5504f","progname":"rails-otel"}
myapp  | {"level":"DEBUG","time":"2023-04-03T09:39:51.715+00:00","msg":"PromotionService.list_vouchers call started","trace_id":"4862c816e54cf50f3d0147068a88ccc7","span_id":"872682563d412c74","trace_flags":"00","node_id":"ac8d3e07-387e-4287-ac2f-4f9414c5504f","progname":"rails-otel"}
myapp  | {"level":"DEBUG","time":"2023-04-03T09:39:52.127+00:00","msg":"PromotionService.list_vouchers done","trace_id":"4862c816e54cf50f3d0147068a88ccc7","span_id":"872682563d412c74","trace_flags":"00","node_id":"ac8d3e07-387e-4287-ac2f-4f9414c5504f","progname":"rails-otel"}
myapp  | {"level":"DEBUG","time":"2023-04-03T09:39:52.128+00:00","msg":"PromotionService.list_vouchers done","trace_id":"4862c816e54cf50f3d0147068a88ccc7","span_id":"872682563d412c74","trace_flags":"00","node_id":"ac8d3e07-387e-4287-ac2f-4f9414c5504f","progname":"rails-otel"}
myapp  | {"level":"DEBUG","time":"2023-04-03T09:39:52.129+00:00","msg":"controller done processing the request, preparing rendering response","trace_id":"4862c816e54cf50f3d0147068a88ccc7","span_id":"872682563d412c74","trace_flags":"00","node_id":"ac8d3e07-387e-4287-ac2f-4f9414c5504f","progname":"rails-otel"}
myapp  | {"level":"DEBUG","time":"2023-04-03T09:39:52.129+00:00","msg":"controller done processing the request, preparing rendering response","trace_id":"4862c816e54cf50f3d0147068a88ccc7","span_id":"872682563d412c74","trace_flags":"00","node_id":"ac8d3e07-387e-4287-ac2f-4f9414c5504f","progname":"rails-otel"}
myapp  | {"level":"INFO","time":"2023-04-03T09:39:52.140+00:00","msg":"Completed 200 OK in 450ms (Views: 5.5ms | ActiveRecord: 5.8ms | Allocations: 11549)\n\n","trace_id":"4862c816e54cf50f3d0147068a88ccc7","span_id":"872682563d412c74","trace_flags":"00","node_id":"ac8d3e07-387e-4287-ac2f-4f9414c5504f","progname":"rails-otel"}
myapp  | {"level":"INFO","time":"2023-04-03T09:39:52.141+00:00","msg":"Completed 200 OK in 450ms (Views: 5.5ms | ActiveRecord: 5.8ms | Allocations: 11549)\n\n","trace_id":"4862c816e54cf50f3d0147068a88ccc7","span_id":"872682563d412c74","trace_flags":"00","node_id":"ac8d3e07-387e-4287-ac2f-4f9414c5504f","progname":"rails-otel"}
Now, as we already add the Jaeger service in the section Add OpenTelemetry SDK, we can see our trace in Jaeger dashboard by accessing JaegerUI http://localhost:16686/search.
And we will see one trace like this (because we only do request once only):
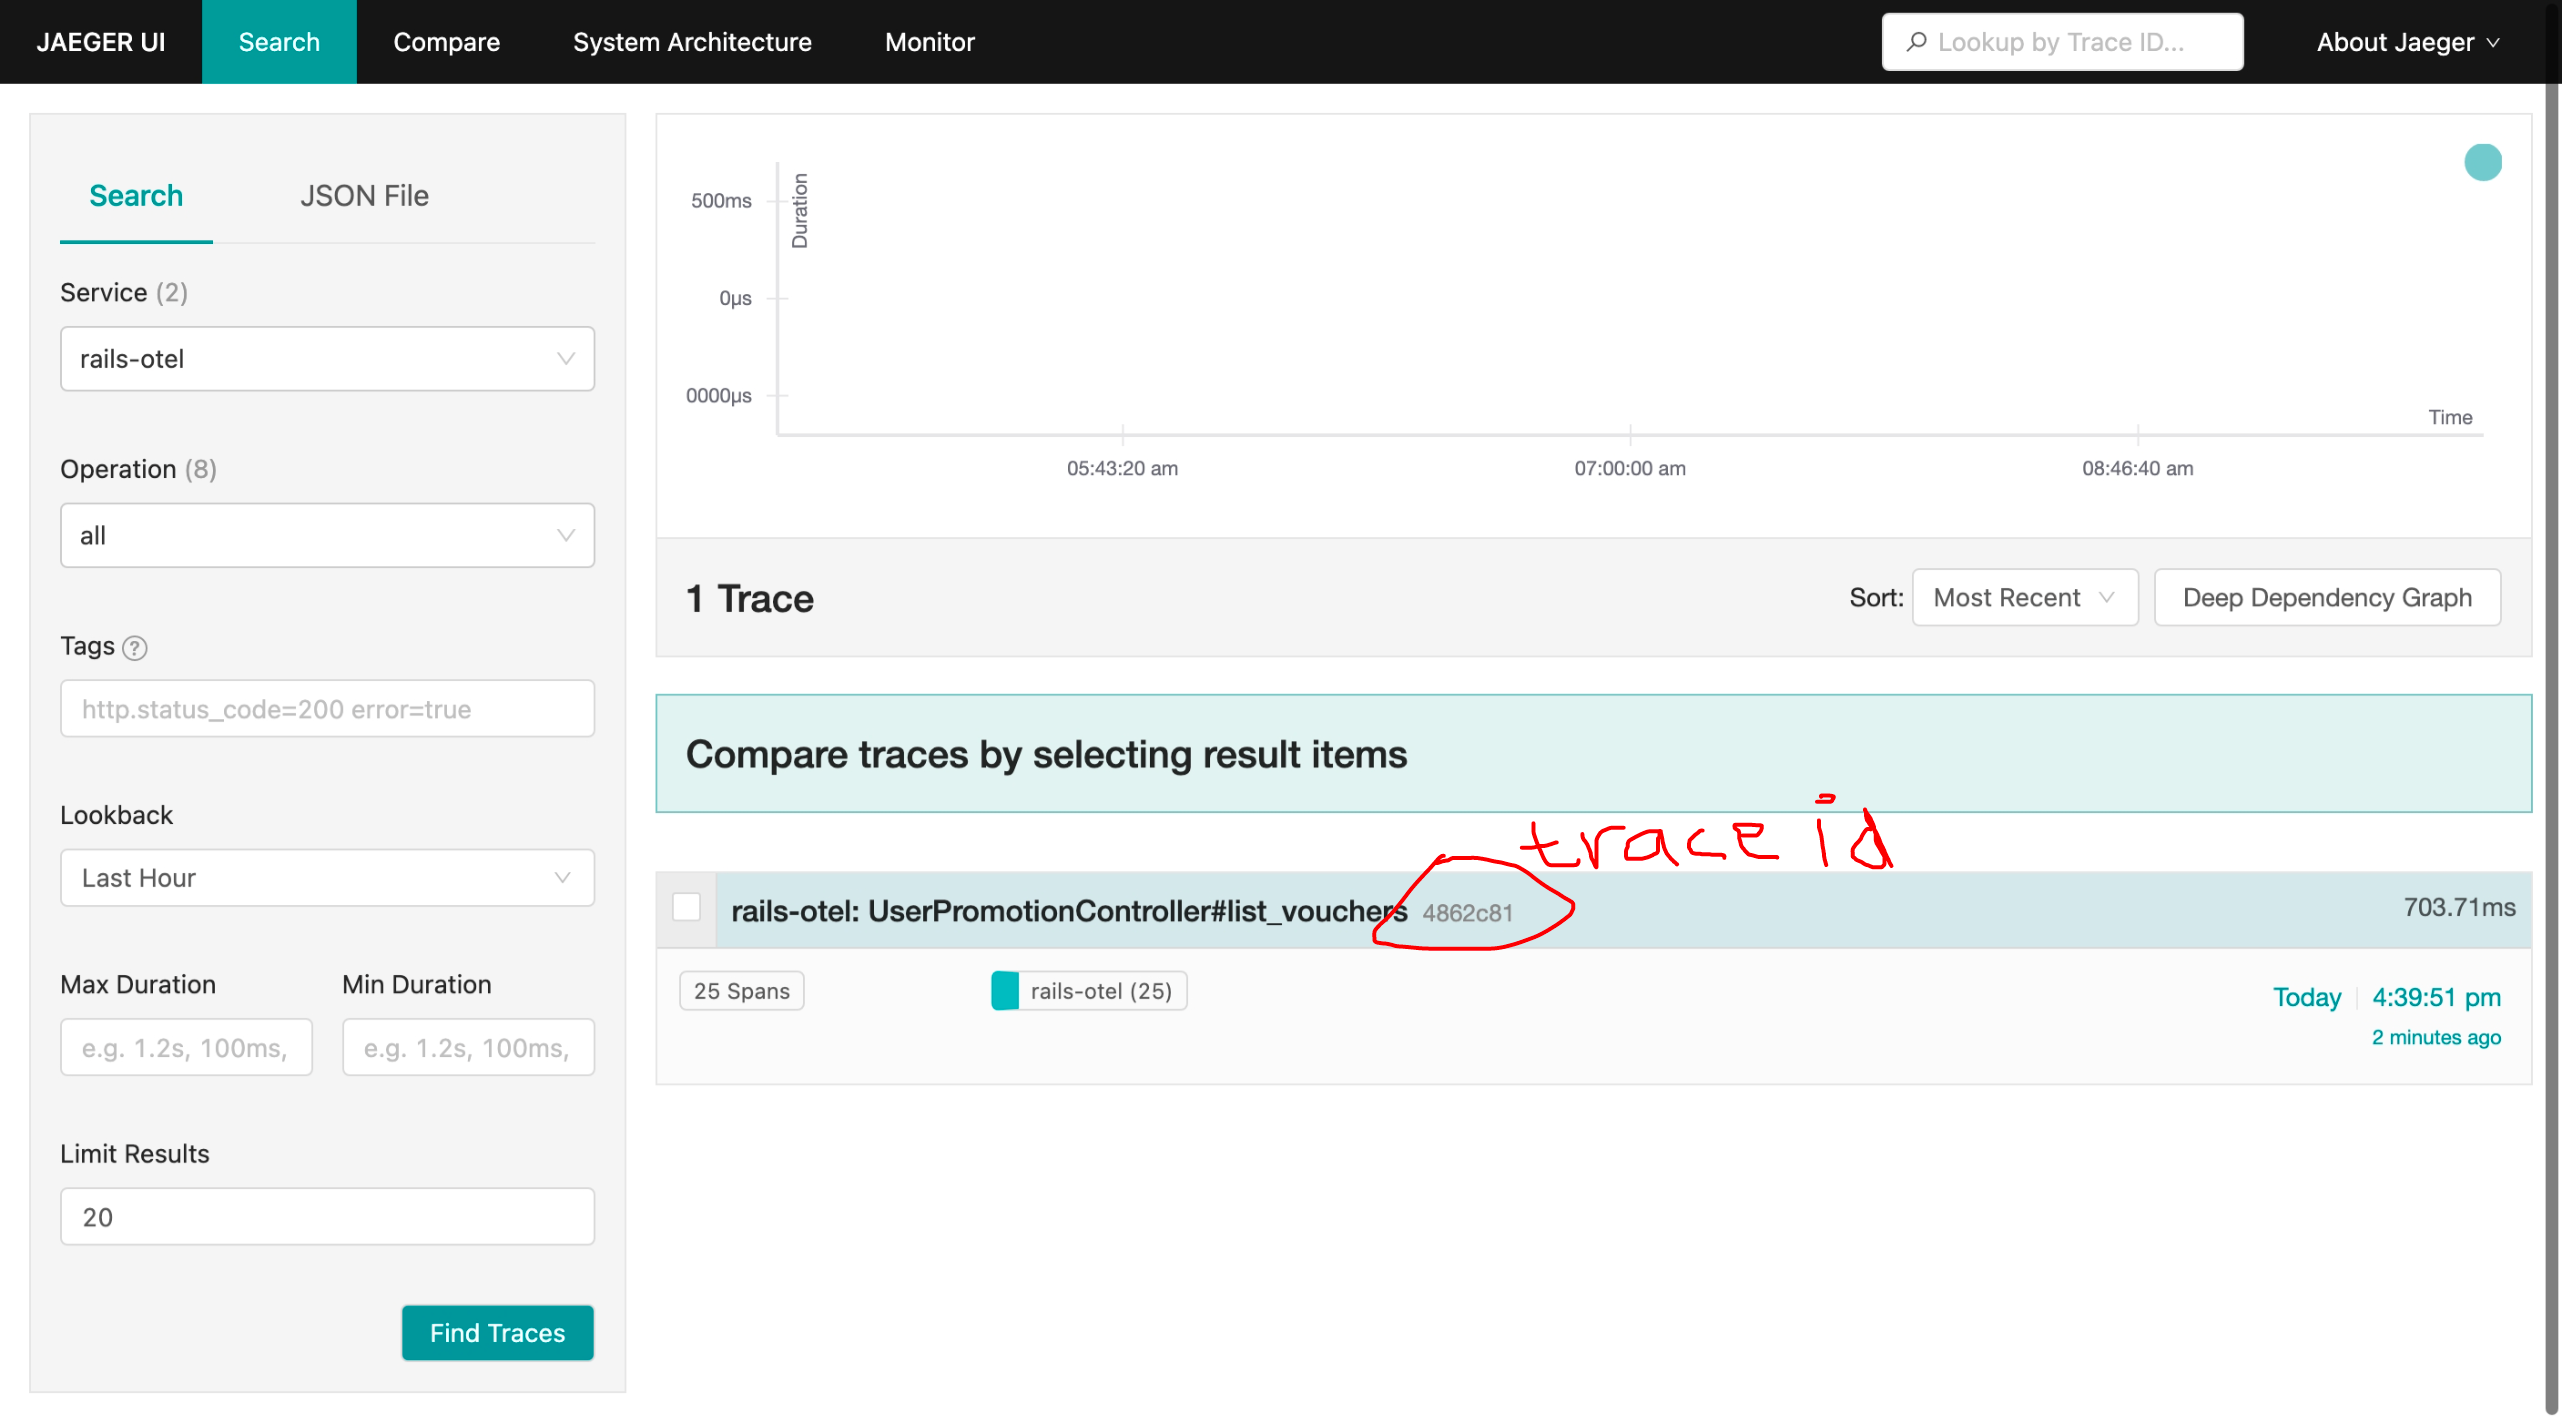
In our log we see that we have a trace id 4862c816e54cf50f3d0147068a88ccc7 and, it match with the Trace ID shown in JaegerUI in http://localhost:16686/trace/4862c816e54cf50f3d0147068a88ccc7.
So, we have two questions:
- How to make this trace id available from the client side? To do this, we want to add key
Traceparentavailable in HTTP response header by creating OpenTelemetry Middleware. This comply with the W3 Recommendation. - What is additional function with suffixes
_ctxsuch asdebug_ctx,info_ctx, etc do? And how to use that? I will cover it in the section
Changes on this section can be seen at this commit e7ad9f7.
Creating OpenTelemetry Middleware #
We need to create a OpenTelemetry middleware in the first middleware stack to ensure:
- If the endpoint is called from another service that already start the tracer, we only need to continue from that tracer ID as the parent. If we don’t do this, it will create new trace that not correlate with the previous trace – and this is bad, because we can’t observe and correlate the API calls.
- We add
Traceparentin response header. This way, the caller (or client who call the app) can see the Trace ID produced by the app. - We print access log in this middleware to ensure we can get request-response log.
To do that, create a file config/middleware_otel.rb:
require 'securerandom'
require "opentelemetry/sdk"
require 'rack/request'

require_relative "logger_active_record_json"

# # Export traces to console by default
# # see https://github.com/open-telemetry/opentelemetry-ruby/blob/opentelemetry-sdk/v1.2.0/sdk/lib/opentelemetry/sdk/configurator.rb#L175-L197
# ENV['OTEL_TRACES_EXPORTER'] ||= 'otlp'

# # Configure propagator
# # see https://github.com/open-telemetry/opentelemetry-ruby/blob/opentelemetry-sdk/v1.2.0/sdk/lib/opentelemetry/sdk/configurator.rb#L199-L216
# ENV['OTEL_PROPAGATORS'] ||= 'tracecontext,baggage,b3'


# MiddlewareLogger this code is based on below link with modification.
# https://github.com/open-telemetry/opentelemetry-ruby/blob/opentelemetry-sdk/v1.2.0/examples/http/server.rb
module MiddlewareLogger
  class RequestContextMiddleware
    def initialize(app)
      @app = app
    end

    def call(env)
      start_time = Time.now

      # Extract context from request headers.
      # This to continue the span if client has sent some propagator key into request header.
      context = OpenTelemetry.propagation.extract(
        env,
        # see https://github.com/open-telemetry/opentelemetry-ruby/blob/opentelemetry-sdk/v1.2.0/common/lib/opentelemetry/common/propagation.rb#L22
        # and https://github.com/open-telemetry/opentelemetry-ruby/blob/opentelemetry-sdk/v1.2.0/common/lib/opentelemetry/common/propagation/rack_env_getter.rb
        getter: OpenTelemetry::Common::Propagation.rack_env_getter,
      )

      # Example: get OpenTelemetry trace id.
      # Trace ID will always the same as traceparent (if exist and continue from client),
      # or from new current span.
      # trace_id = OpenTelemetry::Trace.current_span.context.trace_id.unpack1('H*') # Unpack to hex

      # We use MyAppTracer that we defined in config/initializers/opentelemetry.rb
      # For attribute naming, see
      # https://github.com/open-telemetry/opentelemetry-specification/blob/v1.19.0/specification/trace/semantic_conventions/http.md#http-server
      attributes = {
        'component' => 'http',
        'http.method' => env['REQUEST_METHOD'],
        'http.route' => env['PATH_INFO'],
        'http.url' => env['REQUEST_URI'],
      }

      # Span name SHOULD be set to route:
      span_name = "#{env['REQUEST_METHOD']} #{env['PATH_INFO']}"
      span = MyAppTracer.start_span(span_name, with_parent: context, attributes: attributes)

      # Extract relevant information from the request object
      # see full object here https://rubydoc.info/gems/rack/Rack/Request
      request = Rack::Request.new(env)

      req_method = request.request_method || ''
      req_path = request.path || ''
      req_url = env['REQUEST_URI'] || ''
      req_user_agent = request.user_agent || ''
      req_remote_ip = request.ip || ''

      # Get X-Request-ID value header. This is non W3 standard headers: https://stackoverflow.com/a/27174552
      # But, Heroku has blog about this https://blog.heroku.com/http_request_id_s_improve_visibility_across_the_application_stack
      request_id = SecureRandom.uuid()

      # Get header request values
      req_headers = {}
      req_headers_filter = env.select { |key, value| key.start_with?('HTTP_') }
      req_headers_filter.each do |key, value|
        if key.downcase == 'X-Request-ID'.downcase
            request_id = value.chomp()
        end
        req_headers[key] = value
      end

      # Pass the information to the logger
      log_data = {
        request: {
          method: req_method,
          path: req_path,
          url: req_url,
          user_agent: req_user_agent,
          remote_ip: req_remote_ip,
          # uncomment if you need all request header passed in every log.
          # But, this will return a big object that makes your log hard to see.
          # header: req_headers,
        },
      }

      # Prepare default response
      resp_status, resp_headers, resp_body = 200, {}, ''

      # Activate the extracted context
      # set the span as the current span in the OpenTelemetry context
      OpenTelemetry::Trace.with_span(span) do
        # Call the next middleware in the chain
        # Run application stack
        span.set_attribute('request_id', request_id)

        resp_status, resp_headers, resp_body = @app.call(env)

        span.set_attribute('http.status_code', resp_status)
      end

      # Inject "traceparent" to header response
      # see https://github.com/open-telemetry/opentelemetry-ruby/blob/opentelemetry-sdk/v1.2.0/sdk/lib/opentelemetry/sdk/configurator.rb#L17
      OpenTelemetry.propagation.inject(resp_headers)

      # Inject "X-Request-Id" to header response.
      # The request id must the same as request id if any, if not we already generated one during getting request headers.
      resp_headers['X-Request-Id'] = request_id

      log_data[:response] = {
        status: resp_status,
        header: resp_headers,
      }

      # return the response after it processed on the next call
      return resp_status, resp_headers, resp_body
    rescue Exception => e
      # set the span status to error if an exception is raised
      span.record_exception(e)

      # re-raise the exception
      raise e

    ensure
      MyLogger.info_ctx('access log', log_data)

      # Clear the request context data from the thread-local variable
      Thread.current[:request_id] = nil

      # end the span when the request is complete
      span.finish
    end

   end
end
And in the file config/application.rb we need to:
require_relative "middleware_otel"
and add this config:
# push the MiddlewareLogger::RequestContextMiddleware to head of middleware stack
config.middleware.insert_before(0, MiddlewareLogger::RequestContextMiddleware)
Again, restart the application and make some requests. To validate that we already put the Traceparent in the response header, we can use curl:
curl -v http://localhost:3000/list-vouchers?token={your-token}

cURL To Validate Traceparent Header
curl -v http://localhost:3000/list-vouchers\?token\=eyJhbGciOiJIUzI1NiJ9.eyJ1c2VyX2lkIjoiYzhjNjk5MWMtNjg3ZS00NGNjLTg3NTUtNDc0M2VmNjZkMjY1In0.TCrEUFziQY4800jAT9ioY2mOm_b9eLdC20gtXjdTt14
*   Trying 127.0.0.1:3000...
* Connected to localhost (127.0.0.1) port 3000 (#0)
> GET /list-vouchers?token=eyJhbGciOiJIUzI1NiJ9.eyJ1c2VyX2lkIjoiYzhjNjk5MWMtNjg3ZS00NGNjLTg3NTUtNDc0M2VmNjZkMjY1In0.TCrEUFziQY4800jAT9ioY2mOm_b9eLdC20gtXjdTt14 HTTP/1.1
> Host: localhost:3000
> User-Agent: curl/7.86.0
> Accept: */*
>
* Mark bundle as not supporting multiuse
< HTTP/1.1 200 OK
< X-Frame-Options: SAMEORIGIN
< X-XSS-Protection: 0
< X-Content-Type-Options: nosniff
< X-Download-Options: noopen
< X-Permitted-Cross-Domain-Policies: none
< Referrer-Policy: strict-origin-when-cross-origin
< Content-Type: */*; charset=utf-8
< Vary: Accept
< ETag: W/"0a89d7478ece4a7e8d2b8acbc102aff6"
< Cache-Control: max-age=0, private, must-revalidate
< X-Request-Id: b243ea12-3394-4c49-8faa-ae6f266ff1b7
< X-Runtime: 0.460178
< Server-Timing: start_processing.action_controller;dur=0.32, sql.active_record;dur=1.08, instantiation.active_record;dur=0.04, process_action.action_controller;dur=437.60
< traceparent: 00-a1ac0334fcb72ad1513859d416b5ff26-b819e2324b94eacd-01
< Transfer-Encoding: chunked
<
* Connection #0 to host localhost left intact
{"user":{"id":"c8c6991c-687e-44cc-8755-4743ef66d265","username":"jane","name":"Jane Kepiye Karepe To","created_at":"2023-03-02T09:15:51.346Z","updated_at":"2023-03-02T09:15:51.346Z"},"vouchers":[[{"voucher_code":"REGISTER_ANNIVERSARY","description":"will get 5% discount if user is a loyal users (already joined minimum 1 year)","terms_and_conditions":[{"discount":5,"min_registered_year":1,"registered_date_is_same":true,"registered_month_is_same":true,"name_prefix":""}]}],[{"voucher_code":"I_AM_JAN","description":"will get 1% discount if user have name prefix 'jan' because our app is launched at January!","terms_and_conditions":[{"discount":1,"min_registered_year":0,"registered_date_is_same":false,"registered_month_is_same":false,"name_prefix":""}]}]]}
Also, in the application log, we will see access log with JSON format (Figure 10). We produce request-response data inside field data in the log.
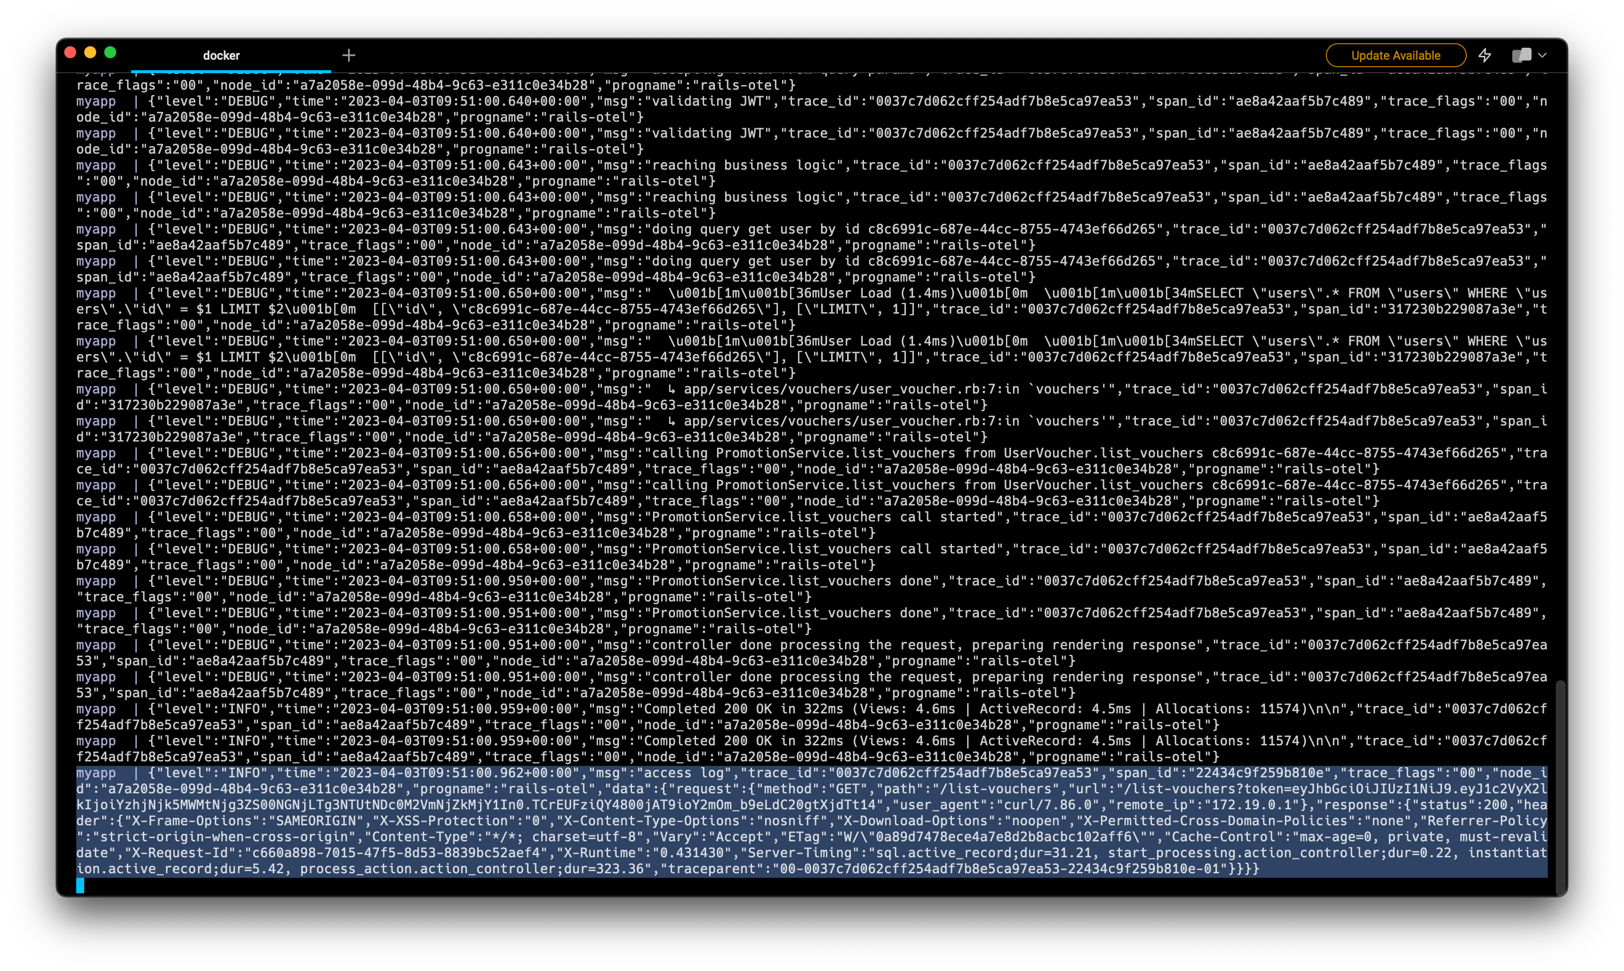
{
  "level": "INFO",
  "time": "2023-04-03T10:14:17.202+00:00",
  "msg": "access log",
  "trace_id": "a1ac0334fcb72ad1513859d416b5ff26",
  "span_id": "b819e2324b94eacd",
  "trace_flags": "00",
  "node_id": "249e7240-36af-49b9-8f82-6cfb2870de34",
  "progname": "rails-otel",
  "data": {
    "request": {
      "method": "GET",
      "path": "/list-vouchers",
      "url": "/list-vouchers?token=eyJhbGciOiJIUzI1NiJ9.eyJ1c2VyX2lkIjoiYzhjNjk5MWMtNjg3ZS00NGNjLTg3NTUtNDc0M2VmNjZkMjY1In0.TCrEUFziQY4800jAT9ioY2mOm_b9eLdC20gtXjdTt14",
      "user_agent": "curl/7.86.0",
      "remote_ip": "172.19.0.1"
    },
    "response": {
      "status": 200,
      "header": {
        "X-Frame-Options": "SAMEORIGIN",
        "X-XSS-Protection": "0",
        "X-Content-Type-Options": "nosniff",
        "X-Download-Options": "noopen",
        "X-Permitted-Cross-Domain-Policies": "none",
        "Referrer-Policy": "strict-origin-when-cross-origin",
        "Content-Type": "*/*; charset=utf-8",
        "Vary": "Accept",
        "ETag": "W/\"0a89d7478ece4a7e8d2b8acbc102aff6\"",
        "Cache-Control": "max-age=0, private, must-revalidate",
        "X-Request-Id": "b243ea12-3394-4c49-8faa-ae6f266ff1b7",
        "X-Runtime": "0.460178",
        "Server-Timing": "start_processing.action_controller;dur=0.32, sql.active_record;dur=1.08, instantiation.active_record;dur=0.04, process_action.action_controller;dur=437.60",
        "traceparent": "00-a1ac0334fcb72ad1513859d416b5ff26-b819e2324b94eacd-01"
      },
      "latency": 467.365584
    }
  }
}
Changes on this section can be seen at this commit 5467b1b.
Using Custom Logger Function #
If you follow this tutorial carefully, you may notice that we now have new logger class called MyLogger that replace (duck-typing) the ActiveRecord::Logger. In the previous section we use MyLogger.info_ctx which takes 2 arguments. In Rails.logger.info it only accepts one argument, and will return error when we pass more arguments.
MyLogger.info_ctx("message", {key: "value on data"}, {attribute: 1}, {attribute: "two"})
# {"level":"INFO","time":"2023-04-03T10:22:49.453+00:00","msg":"message","trace_id":"00000000000000000000000000000000","span_id":"0000000000000000","trace_flags":"00","node_id":"6f8d4021-f917-4ee7-84f4-2aa903ba6e63","progname":"rails-otel","data":{"key":"value on data"},"attributes":[{"attribute":1},{"attribute":"two"}]}

Rails.logger.info("message", {key: "value on data"}, {attribute: 1}, {attribute: "two"})
# /usr/local/lib/ruby/3.2.0/logger.rb:694:in `info': wrong number of arguments (given 4, expected 0..1) (ArgumentError)

Rails.logger.info("message")
# {"level":"INFO","time":"2023-04-03T10:23:14.739+00:00","msg":"message","trace_id":"00000000000000000000000000000000","span_id":"0000000000000000","trace_flags":"00","node_id":"6f8d4021-f917-4ee7-84f4-2aa903ba6e63","progname":"rails-otel"}
# {"level":"INFO","time":"2023-04-03T10:23:14.739+00:00","msg":"message","trace_id":"00000000000000000000000000000000","span_id":"0000000000000000","trace_flags":"00","node_id":"6f8d4021-f917-4ee7-84f4-2aa903ba6e63","progname":"rails-otel"}
All new function that we write in section Duck-typing the Ruby ActiveRecord Logger is to make our life easier to produce the log with data. For example, in access log we need a data with structure:
{
  "data": {
    "request": {},
    "response": {}
  }
}
But in another case such as publishing message to Kafka we only want to produce data with:
{
  "data": {
    "kafka_topic": "",
    "payload": {}
  }
}
Also, we accept the 3rd arguments as an optional parameter. It can accepts any value as long as it can be decoded into JSON (i.e: Hash as JSON object, Array as JSON array, etc). It useful when we want to add some information that only available in certain function. For example, we cannot get the username from the access log because the OpenTelemetry middleware should be installed in the first stack (in the sample code we place it in the
business logic level code), so it cannot be printed in the middleware. username value is only available after
this line.
So, we can change our code a bit.
From:
Rails.logger.debug "calling PromotionService.list_vouchers from UserVoucher.list_vouchers #{user_id}"
That produces log:
{"level":"DEBUG","time":"2023-04-03T10:43:45.525+00:00","msg":"calling PromotionService.list_vouchers from UserVoucher.list_vouchers c8c6991c-687e-44cc-8755-4743ef66d265","trace_id":"26136c1a589d1a1735e517f36a4c71ed","span_id":"f32d0b8848232ea8","trace_flags":"00","node_id":"1312c7ba-d448-42a5-95d5-0bb32b837d61","progname":"rails-otel"}
To:
Rails.logger.debug_ctx(
  "calling PromotionService.list_vouchers from UserVoucher.list_vouchers",
  nil,
  {username: user.username},
)
That produces:
{"level":"DEBUG","time":"2023-04-03T10:44:38.701+00:00","msg":"calling PromotionService.list_vouchers from UserVoucher.list_vouchers","trace_id":"6c93b69dd5e395f20c5338375a540bd5","span_id":"72a37953b7e9cd79","trace_flags":"00","node_id":"1312c7ba-d448-42a5-95d5-0bb32b837d61","progname":"rails-otel","attributes":[{"username":"jane"}]}
Changes on this section can be seen at this commit 81ffd38.
Bonus: Add Trace using OpenTelemetry #
When you see on Figure 8, you see that in one request there will be 25 spans. But, after adding OpenTelemetry middleware, it will be 26 spans because we adding new span here.
span_name = "#{env['REQUEST_METHOD']} #{env['PATH_INFO']}"
span = MyAppTracer.start_span(span_name, with_parent: context, attributes: attributes)
But, the interesting thing is when we look at the Figure 11, the first request with trace ID 691f94e (Figure 12) has more Span than second request (trace ID fbcc7d5, Figure 13). Also, we notice that in the third request it has 20 spans but before that, the Rails produce the DEALLOCATE span (Figure 14).
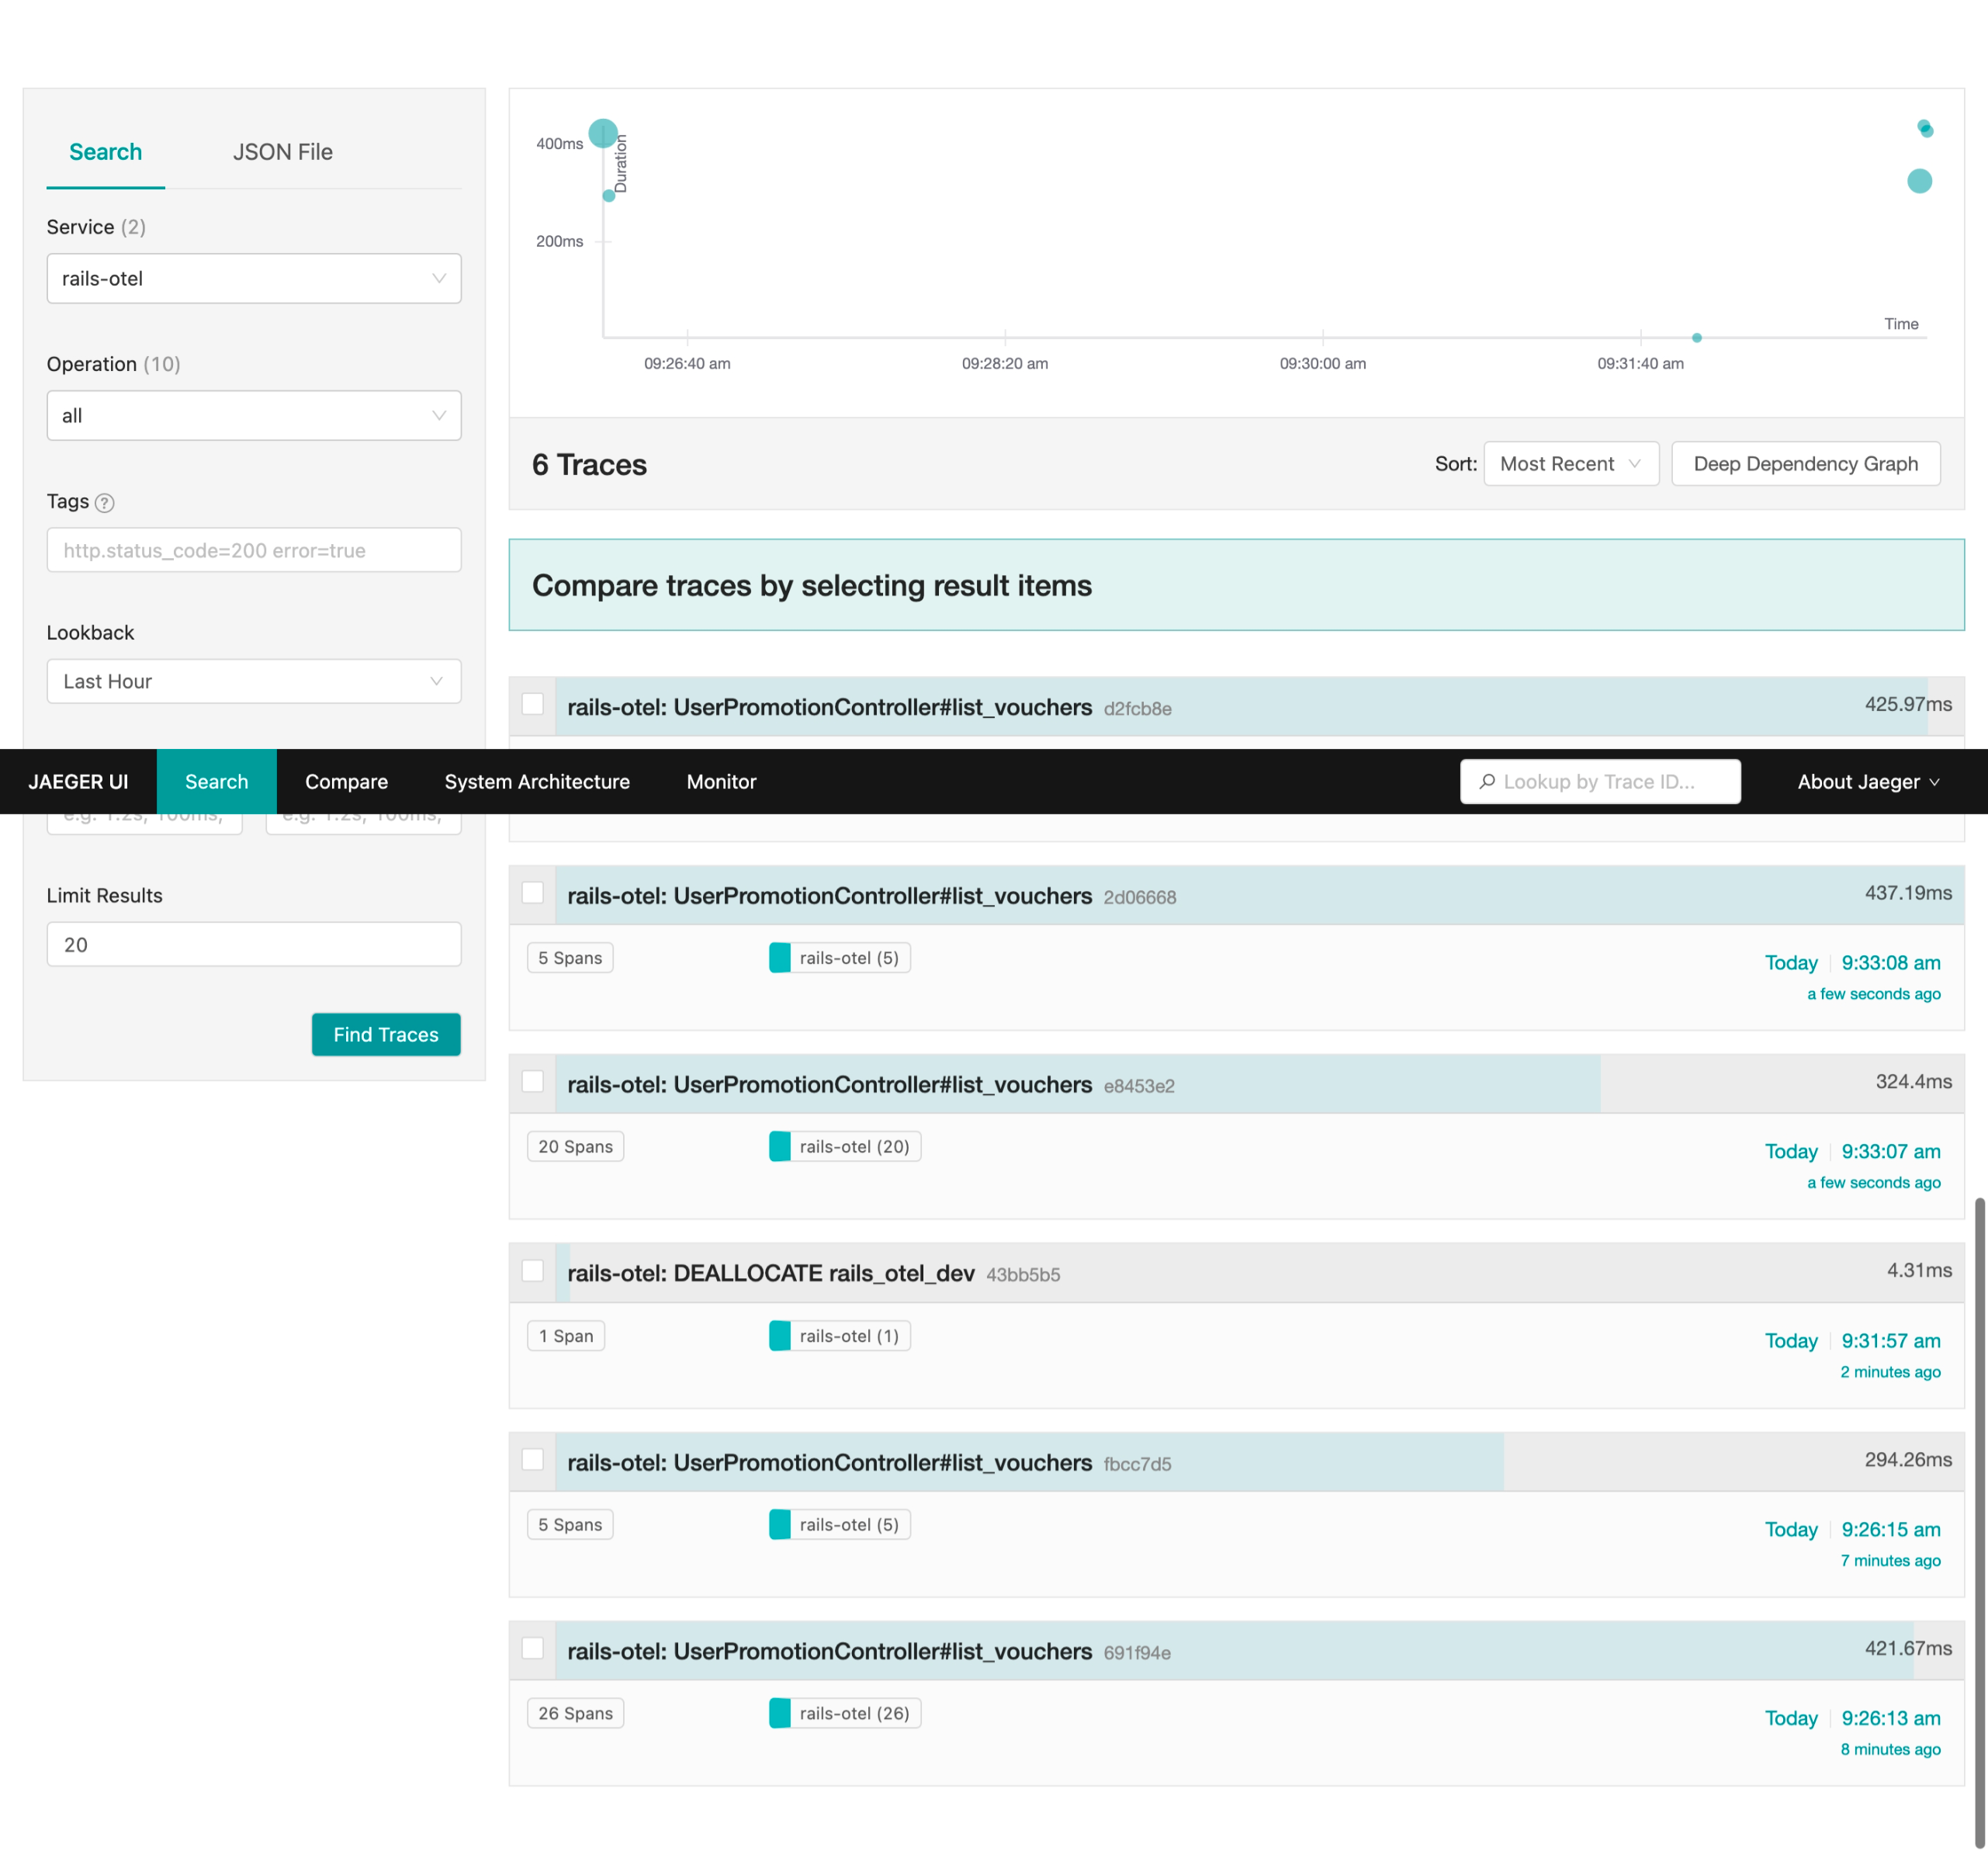
Here’s the timeline of the requests, and it’s Trace ID:
- April 4 2023, 09:26:13.485 -> 691f94e426b88f0c96a1c38b7ecbceb9 -> Figure 12
- April 4 2023, 09:26:15.277 -> fbcc7d5139bcaf6cbe9755a8b95f4503 -> Figure 13
- April 4 2023, 09:31:57.623 -> 43bb5b582cb4c8e801dce2449e61aca6 -> Figure 14
- April 4 2023, 09:33:07.753 -> e8453e2284e26bf1a4bbf4b5ddeb7c8e -> Figure 15
- April 4 2023, 09:33:08.984 -> 2d0666880d55e6e194cc6a89d02634f4 -> Figure 16
- April 4 2023, 09:33:10.040 -> d2fcb8edaa56c09fd1cf4efcddebe3b9 -> Figure 17
Collection of JaegerUI
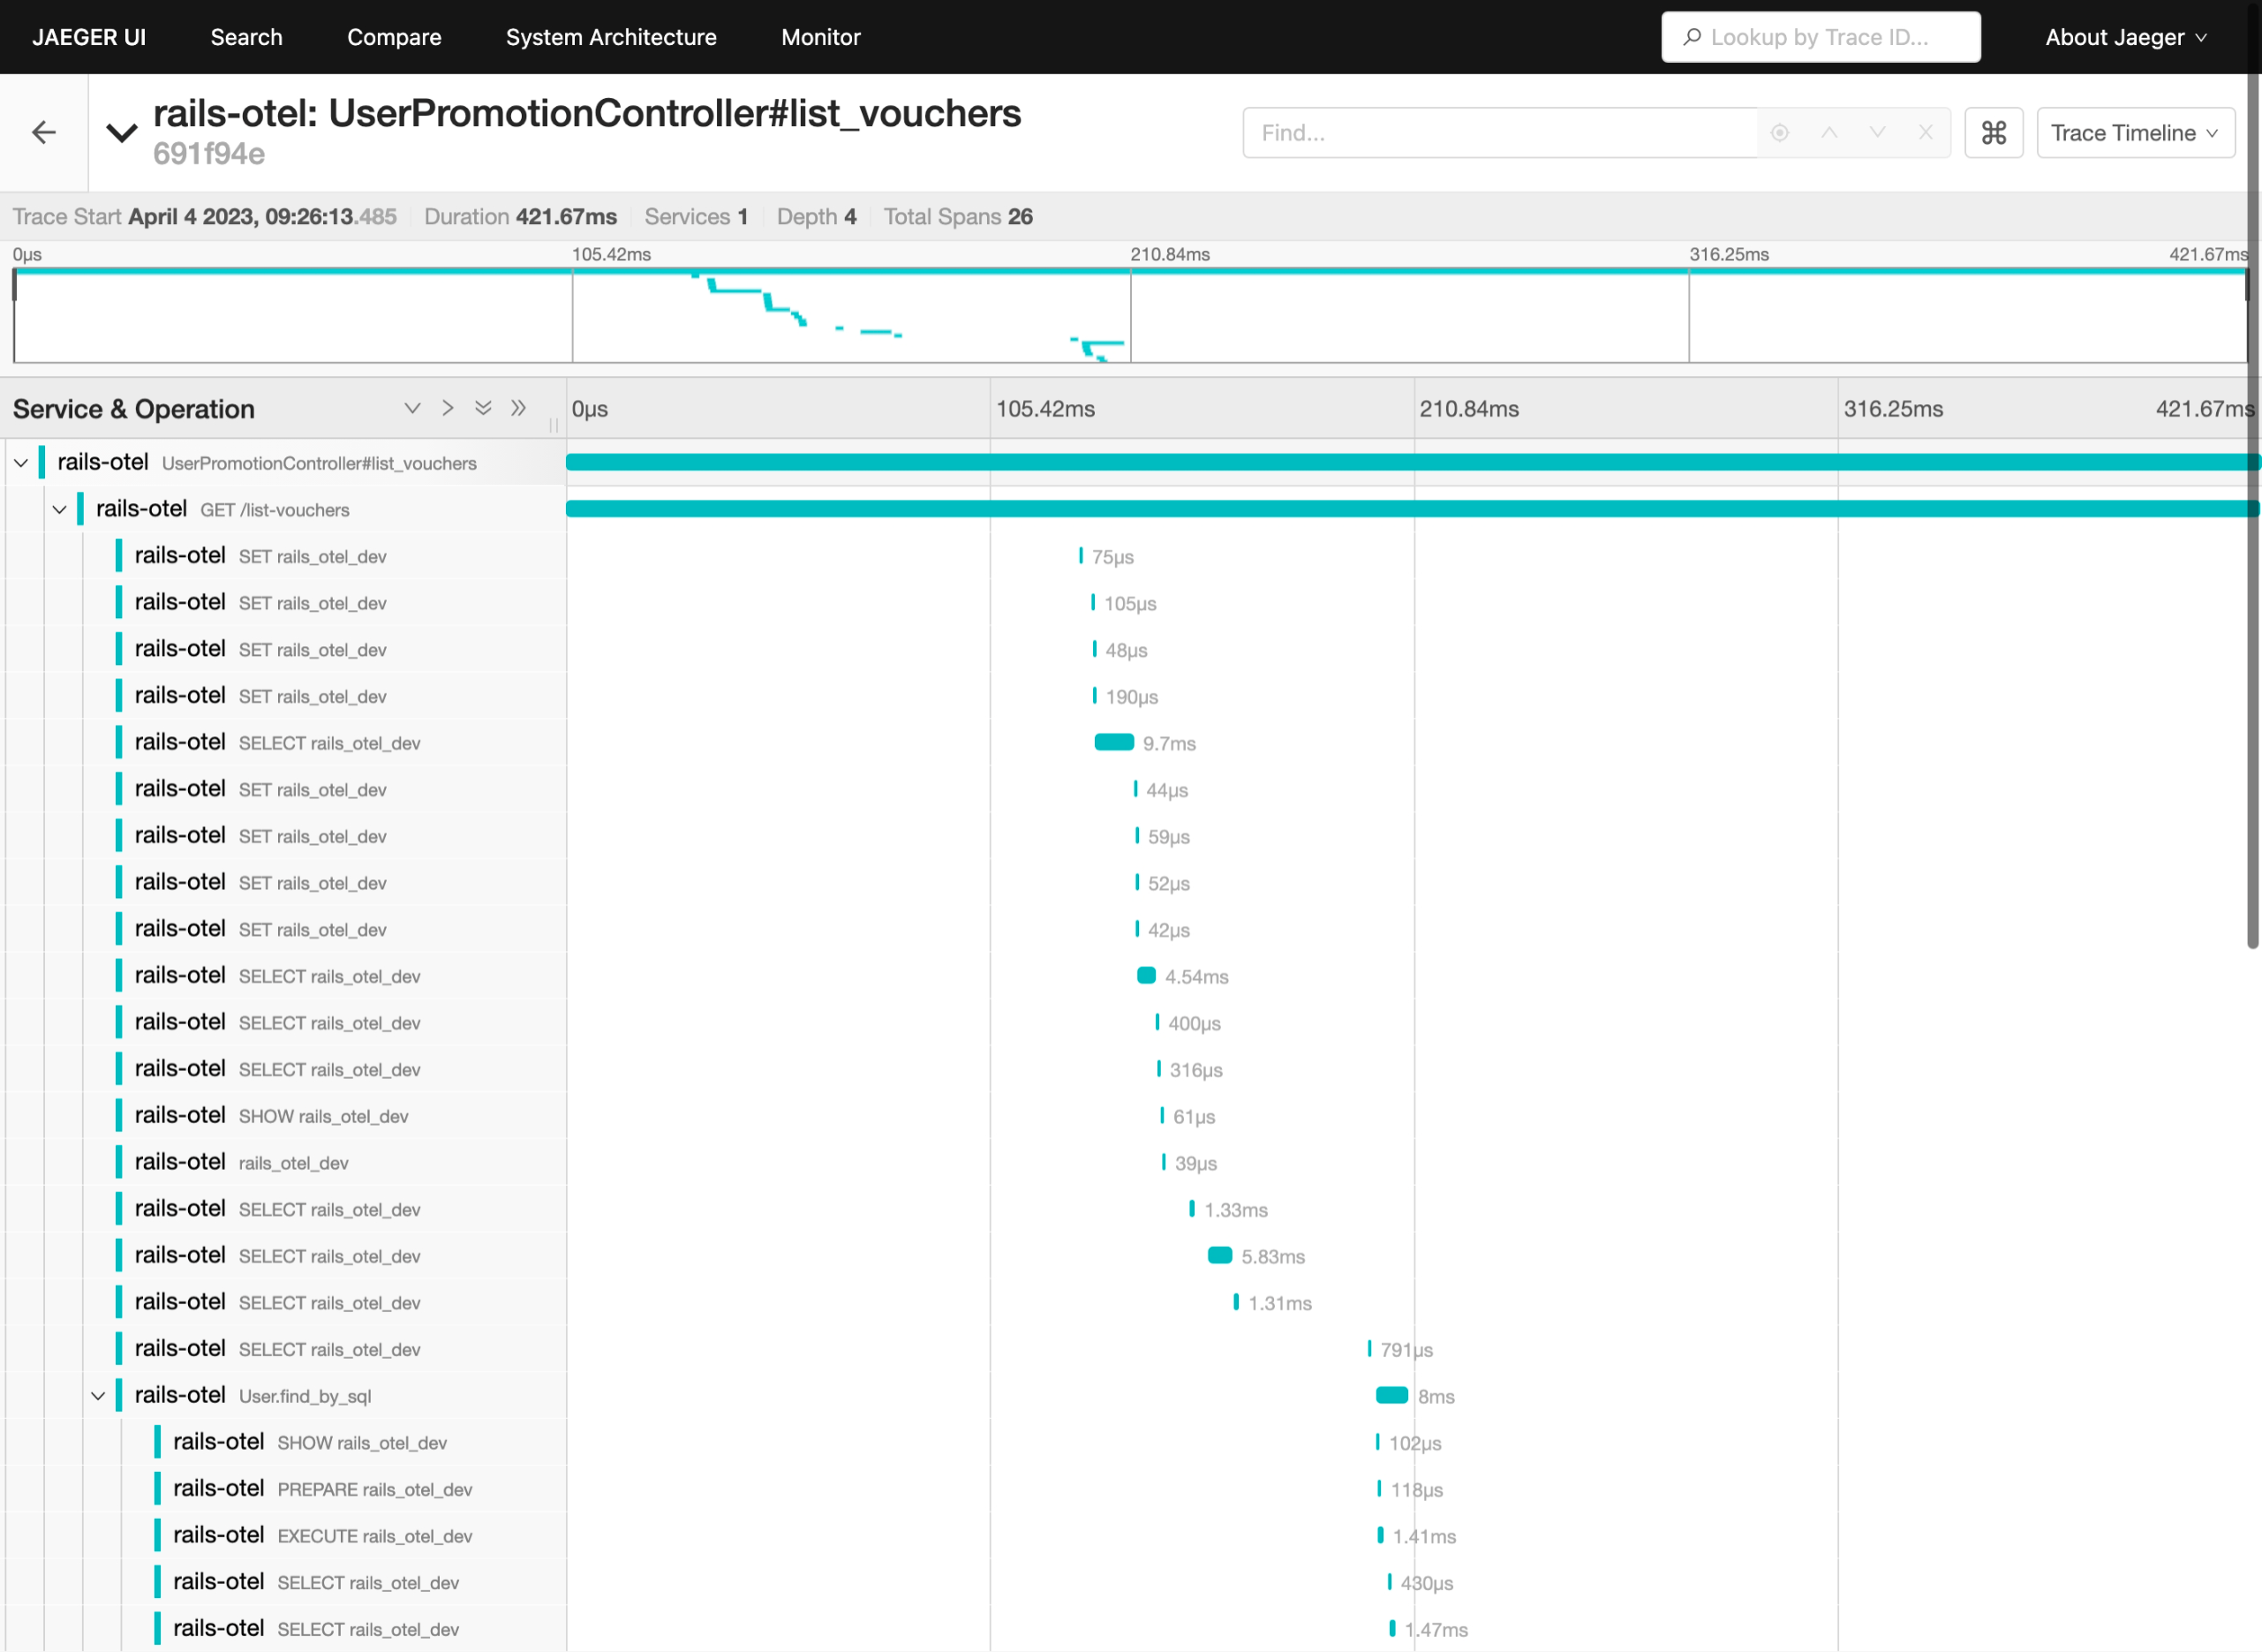
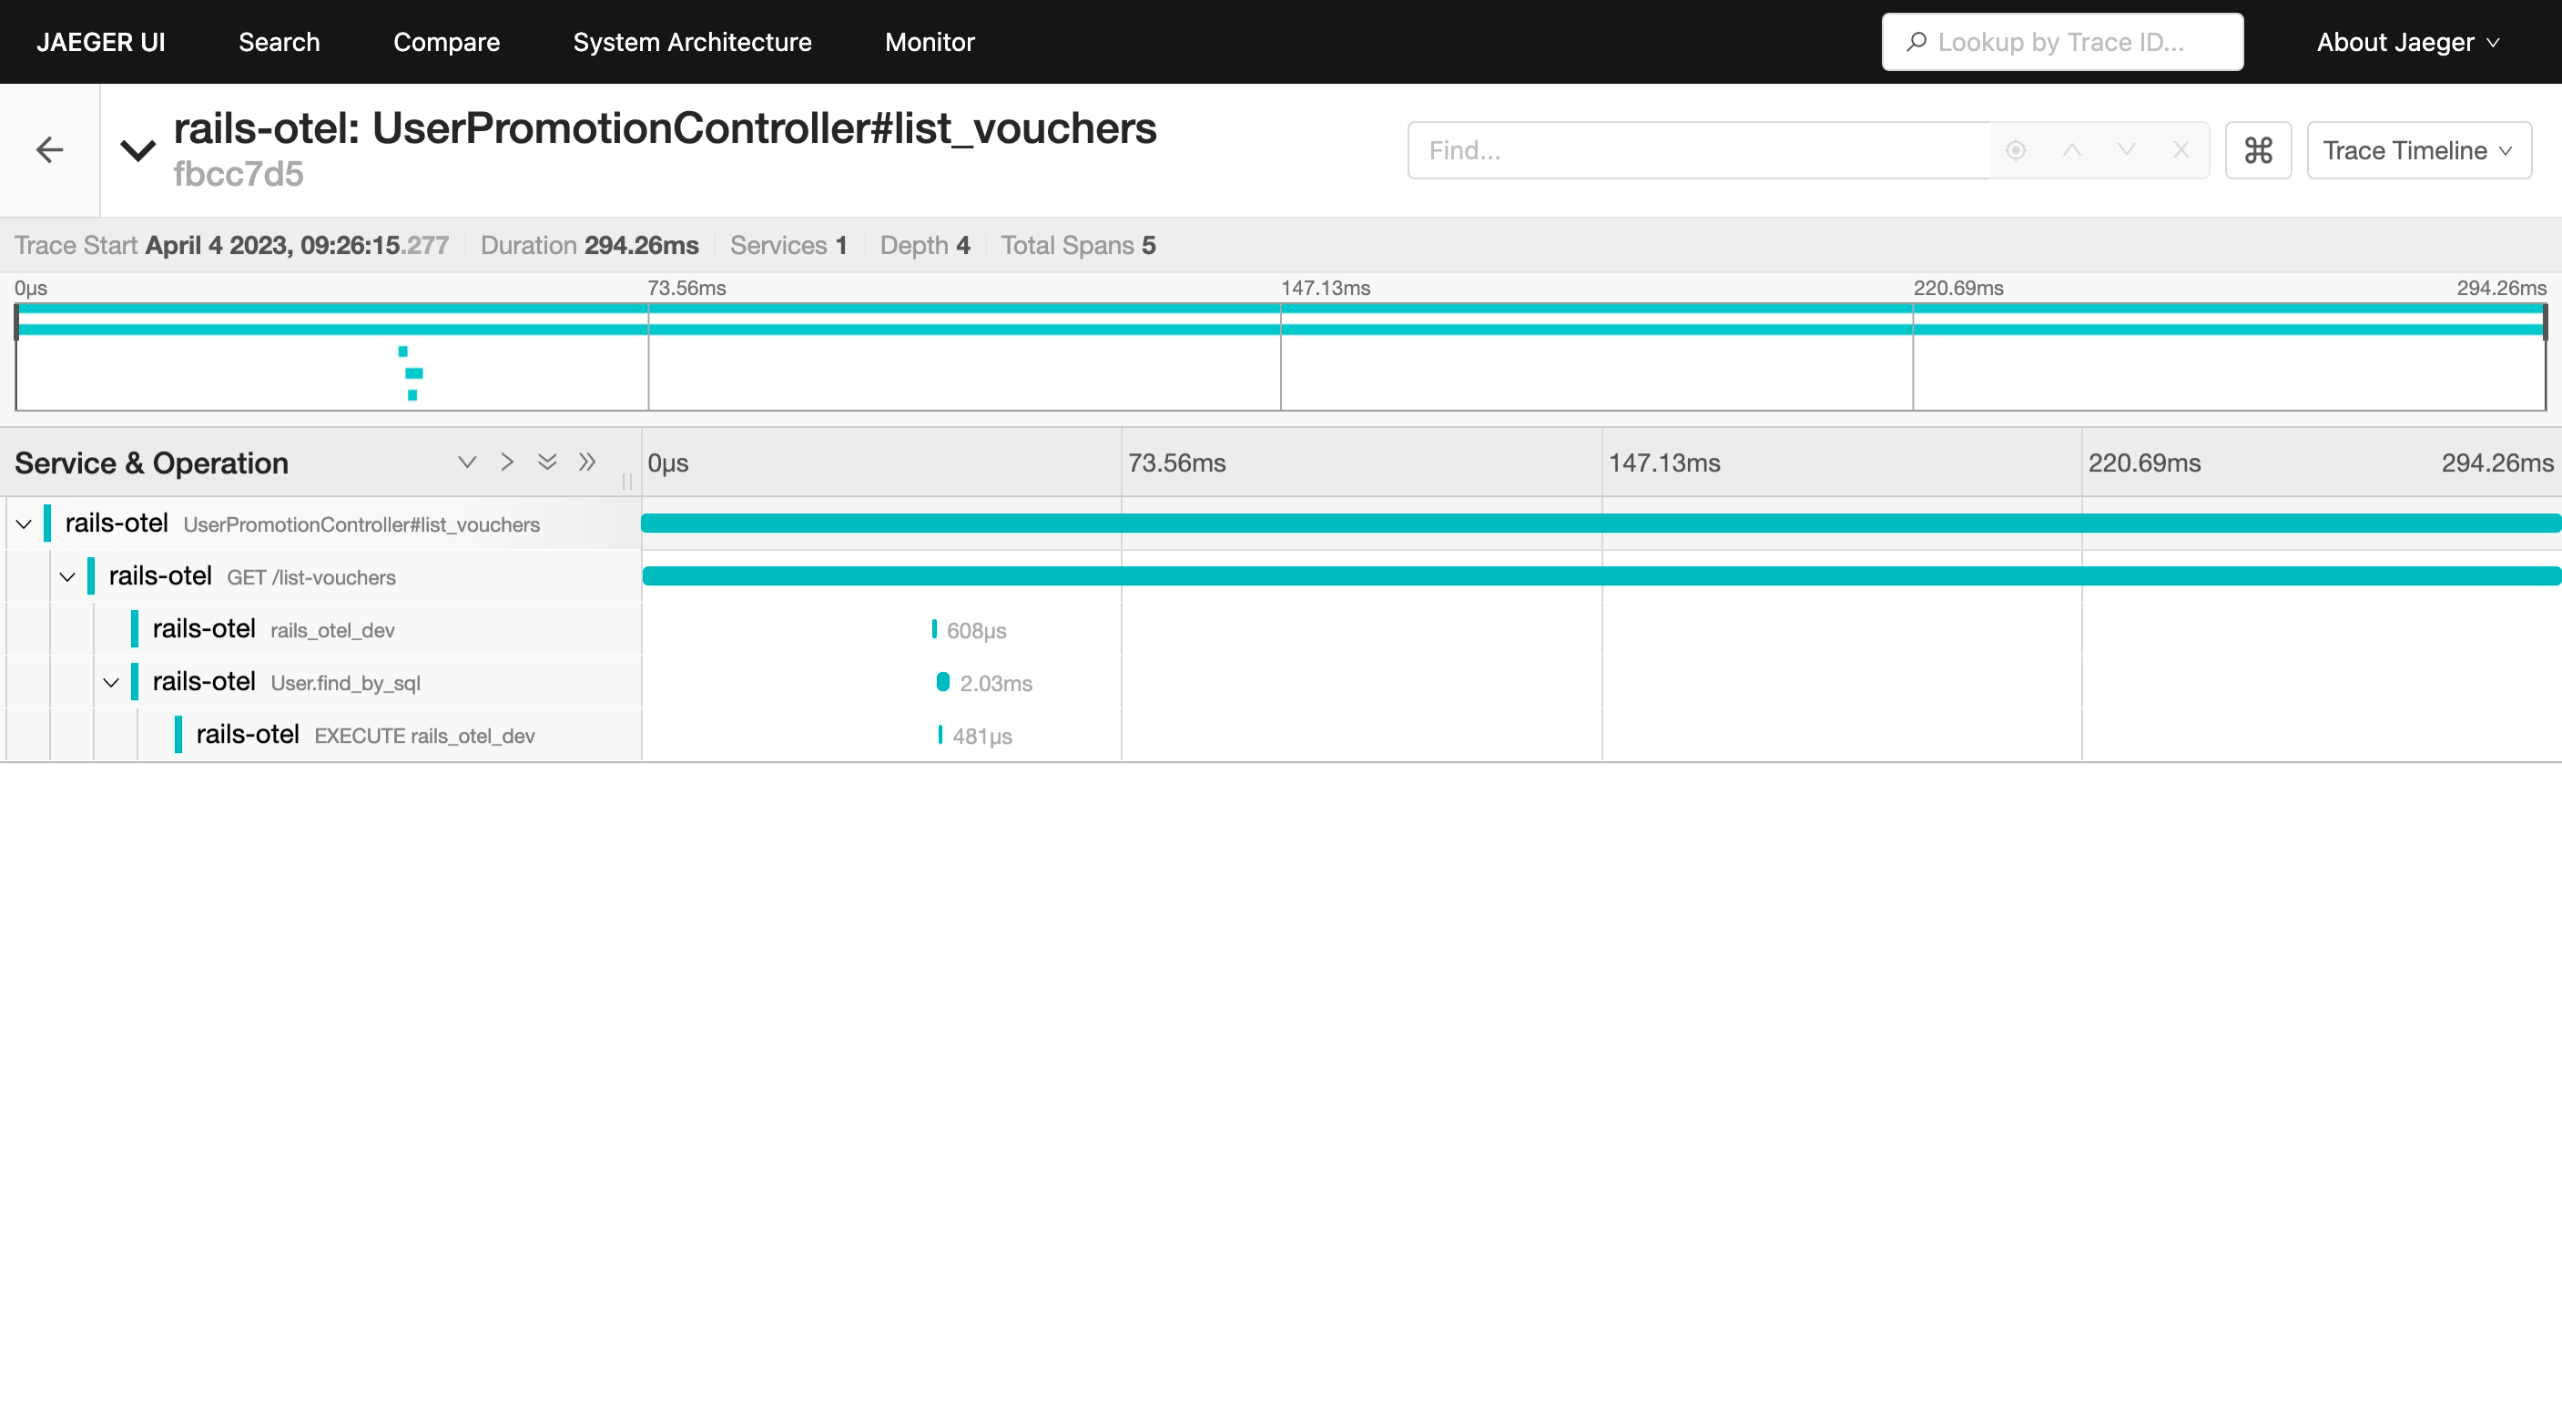

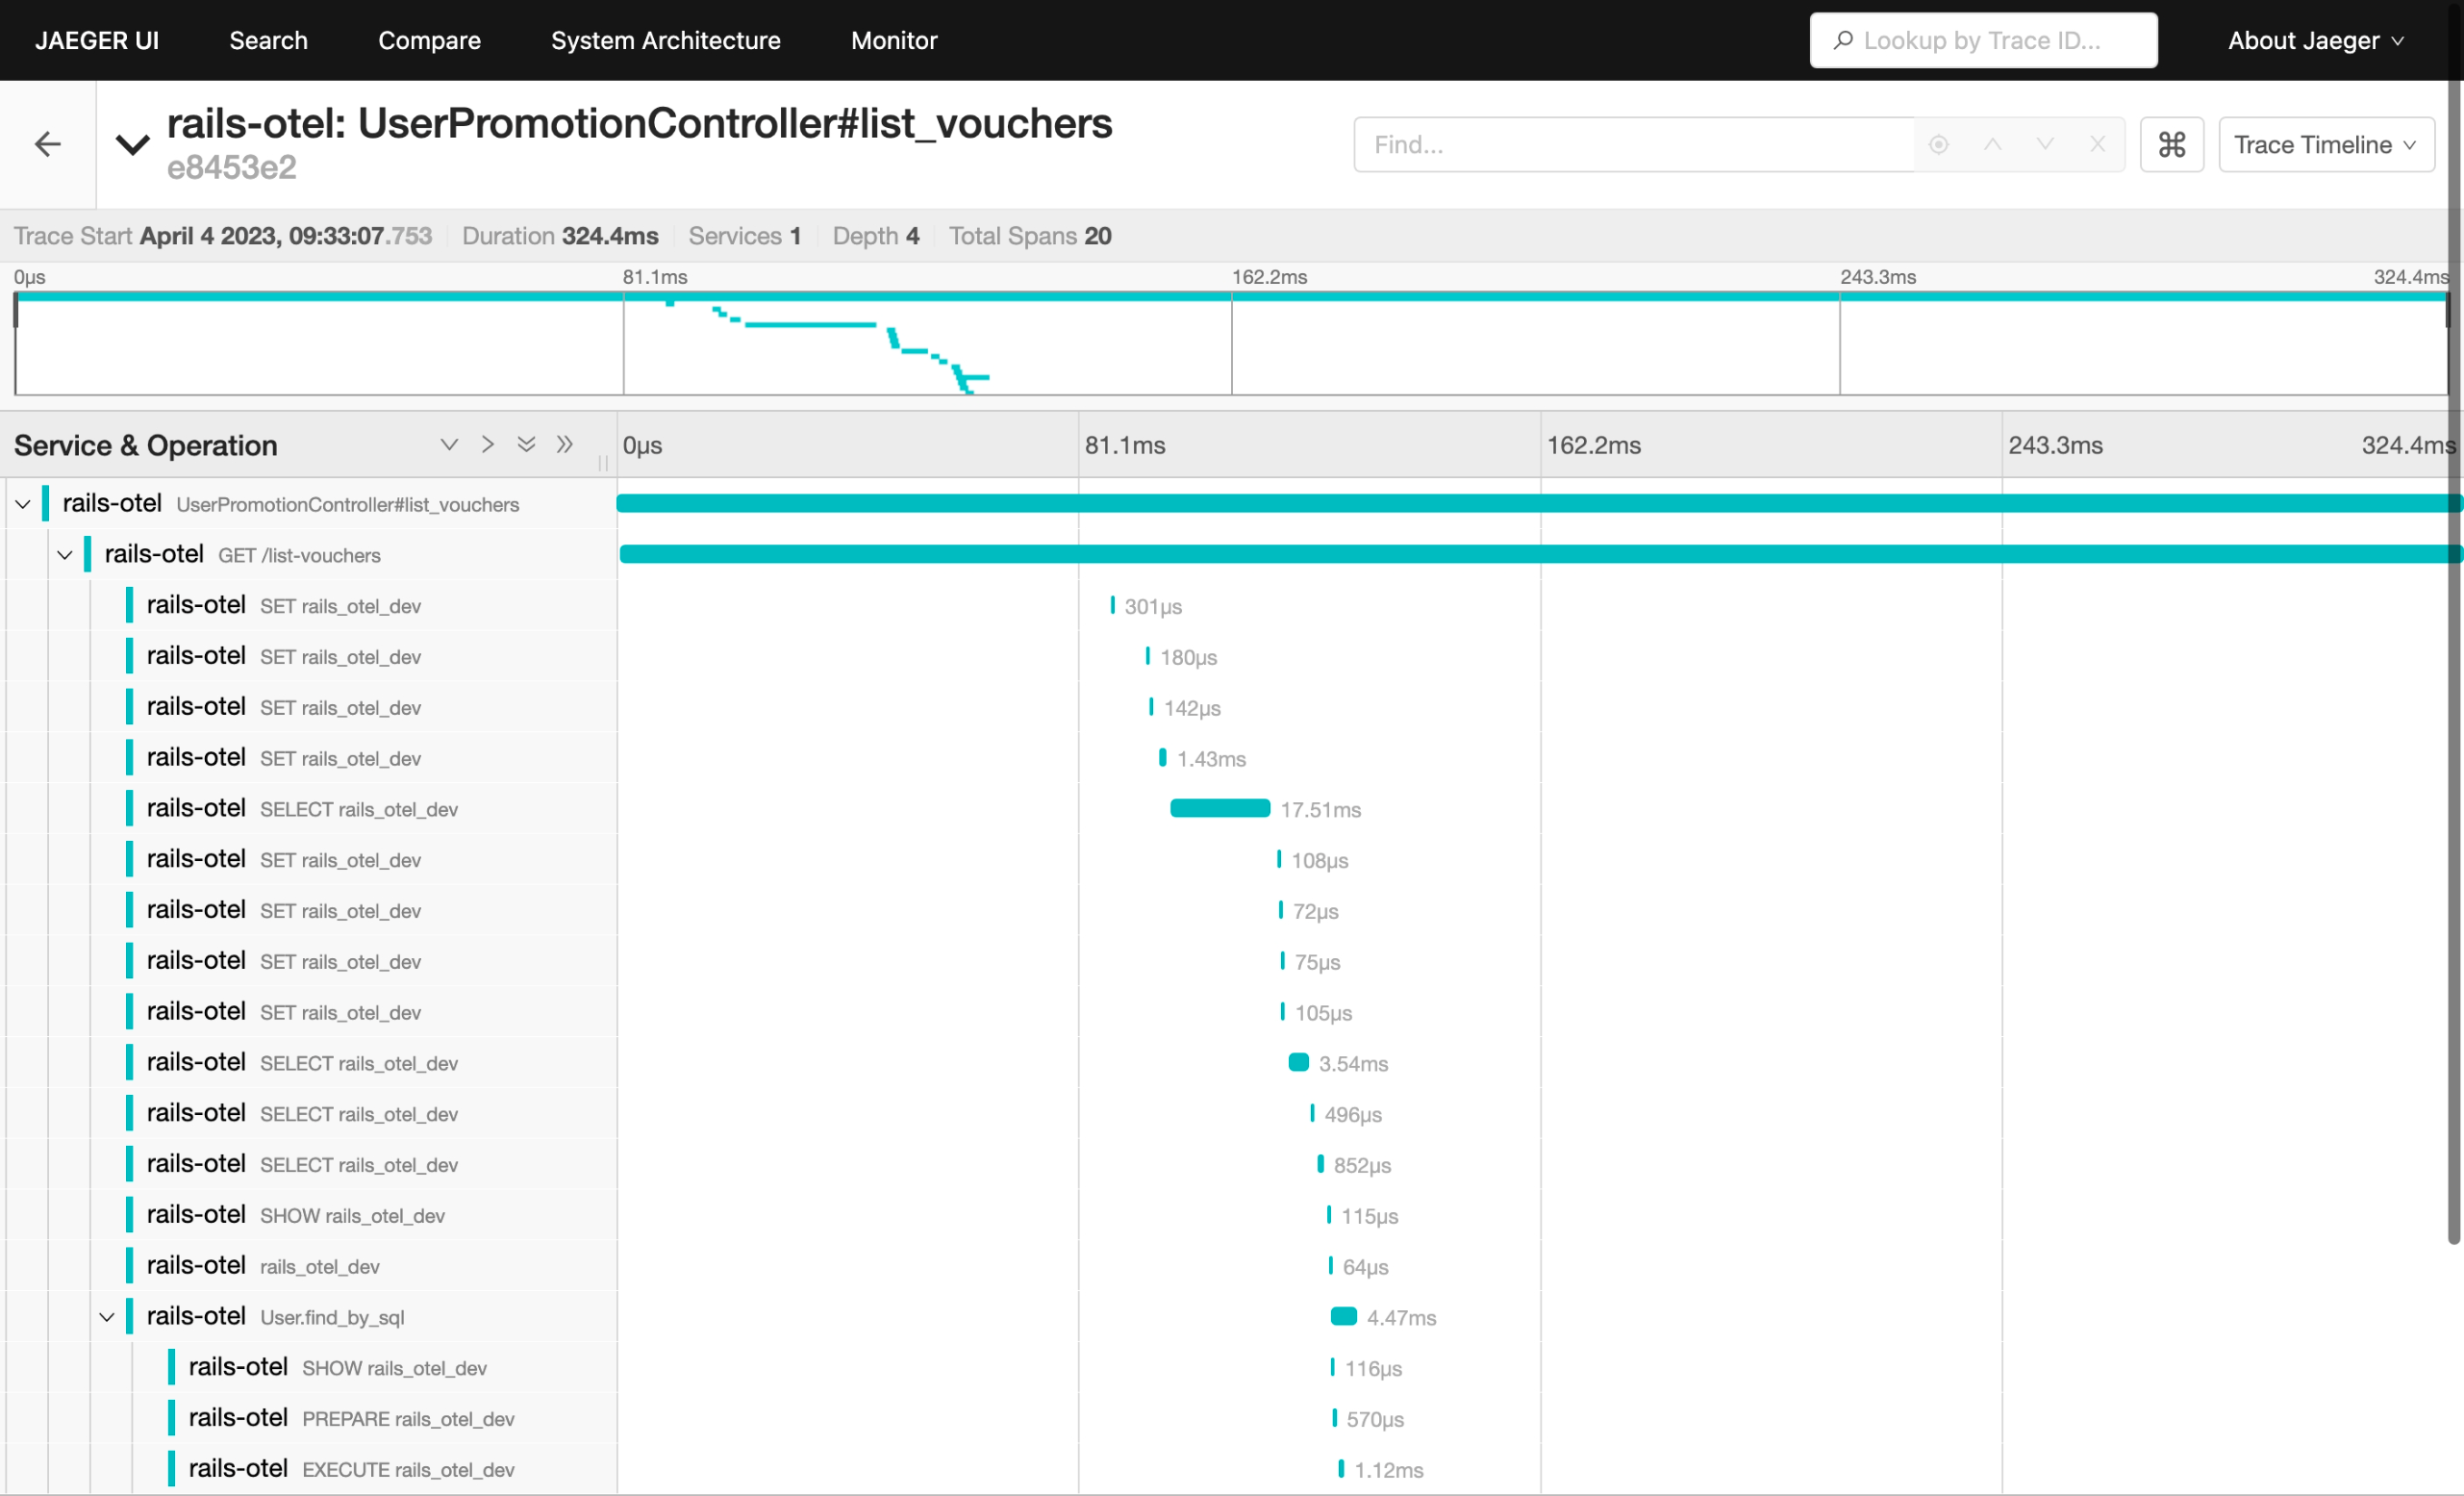


But, I don’t want to focus on this, I assume that those behavior is part of the magic from Rails framework.
In this section, I want to show you how to add new span. For example, in the trace ID d2fcb8edaa56c09fd1cf4efcddebe3b9 (Figure 17), we only have 5 spans. Which create the waterfall like this:
UserPromotionController#list_vouchers
  -> GET /list-vouchers
     -> rails_otel_dev
     -> User.find_by_sql
        -> EXECUTE rails_otel_dev
But, in our code we have some function that does not show in the span such as function Vouchers::UserVoucher::vouchers which then call Promotions::PromotionService::list_vouchers. To make it visible, we need to wrap our code with this block:
MyAppTracer.in_span("your span name") do |span|
  # the rest of your code that want be traced
end
This is documented here on the release tag 2023.04.
Now, if we access our app, the JaegerUI tracing will show as shown in Figure 18.
curl -v http://localhost:3000/list-vouchers\?token\=eyJhbGciOiJIUzI1NiJ9.eyJ1c2VyX2lkIjoiYzhjNjk5MWMtNjg3ZS00NGNjLTg3NTUtNDc0M2VmNjZkMjY1In0.TCrEUFziQY4800jAT9ioY2mOm_b9eLdC20gtXjdTt14
*   Trying 127.0.0.1:3000...
* Connected to localhost (127.0.0.1) port 3000 (#0)
> GET /list-vouchers?token=eyJhbGciOiJIUzI1NiJ9.eyJ1c2VyX2lkIjoiYzhjNjk5MWMtNjg3ZS00NGNjLTg3NTUtNDc0M2VmNjZkMjY1In0.TCrEUFziQY4800jAT9ioY2mOm_b9eLdC20gtXjdTt14 HTTP/1.1
> Host: localhost:3000
> User-Agent: curl/7.86.0
> Accept: */*
>
* Mark bundle as not supporting multiuse
< HTTP/1.1 200 OK
< X-Frame-Options: SAMEORIGIN
< X-XSS-Protection: 0
< X-Content-Type-Options: nosniff
< X-Download-Options: noopen
< X-Permitted-Cross-Domain-Policies: none
< Referrer-Policy: strict-origin-when-cross-origin
< Content-Type: */*; charset=utf-8
< Vary: Accept
< ETag: W/"0a89d7478ece4a7e8d2b8acbc102aff6"
< Cache-Control: max-age=0, private, must-revalidate
< X-Request-Id: d8c74eb4-4b80-4824-a40d-f82881b3bba2
< X-Runtime: 0.411438
< Server-Timing: start_processing.action_controller;dur=0.64, sql.active_record;dur=3.71, instantiation.active_record;dur=0.44, process_action.action_controller;dur=377.52
< traceparent: 00-a8f1b4a938dd800bef349037d25b9524-f63a980145e5e597-01
< Transfer-Encoding: chunked
<
* Connection #0 to host localhost left intact
{"user":{"id":"c8c6991c-687e-44cc-8755-4743ef66d265","username":"jane","name":"Jane Kepiye Karepe To","created_at":"2023-03-02T09:15:51.346Z","updated_at":"2023-03-02T09:15:51.346Z"},"vouchers":[[{"voucher_code":"REGISTER_ANNIVERSARY","description":"will get 5% discount if user is a loyal users (already joined minimum 1 year)","terms_and_conditions":[{"discount":5,"min_registered_year":1,"registered_date_is_same":true,"registered_month_is_same":true,"name_prefix":""}]}],[{"voucher_code":"I_AM_JAN","description":"will get 1% discount if user have name prefix 'jan' because our app is launched at January!","terms_and_conditions":[{"discount":1,"min_registered_year":0,"registered_date_is_same":false,"registered_month_is_same":false,"name_prefix":""}]}]]}%
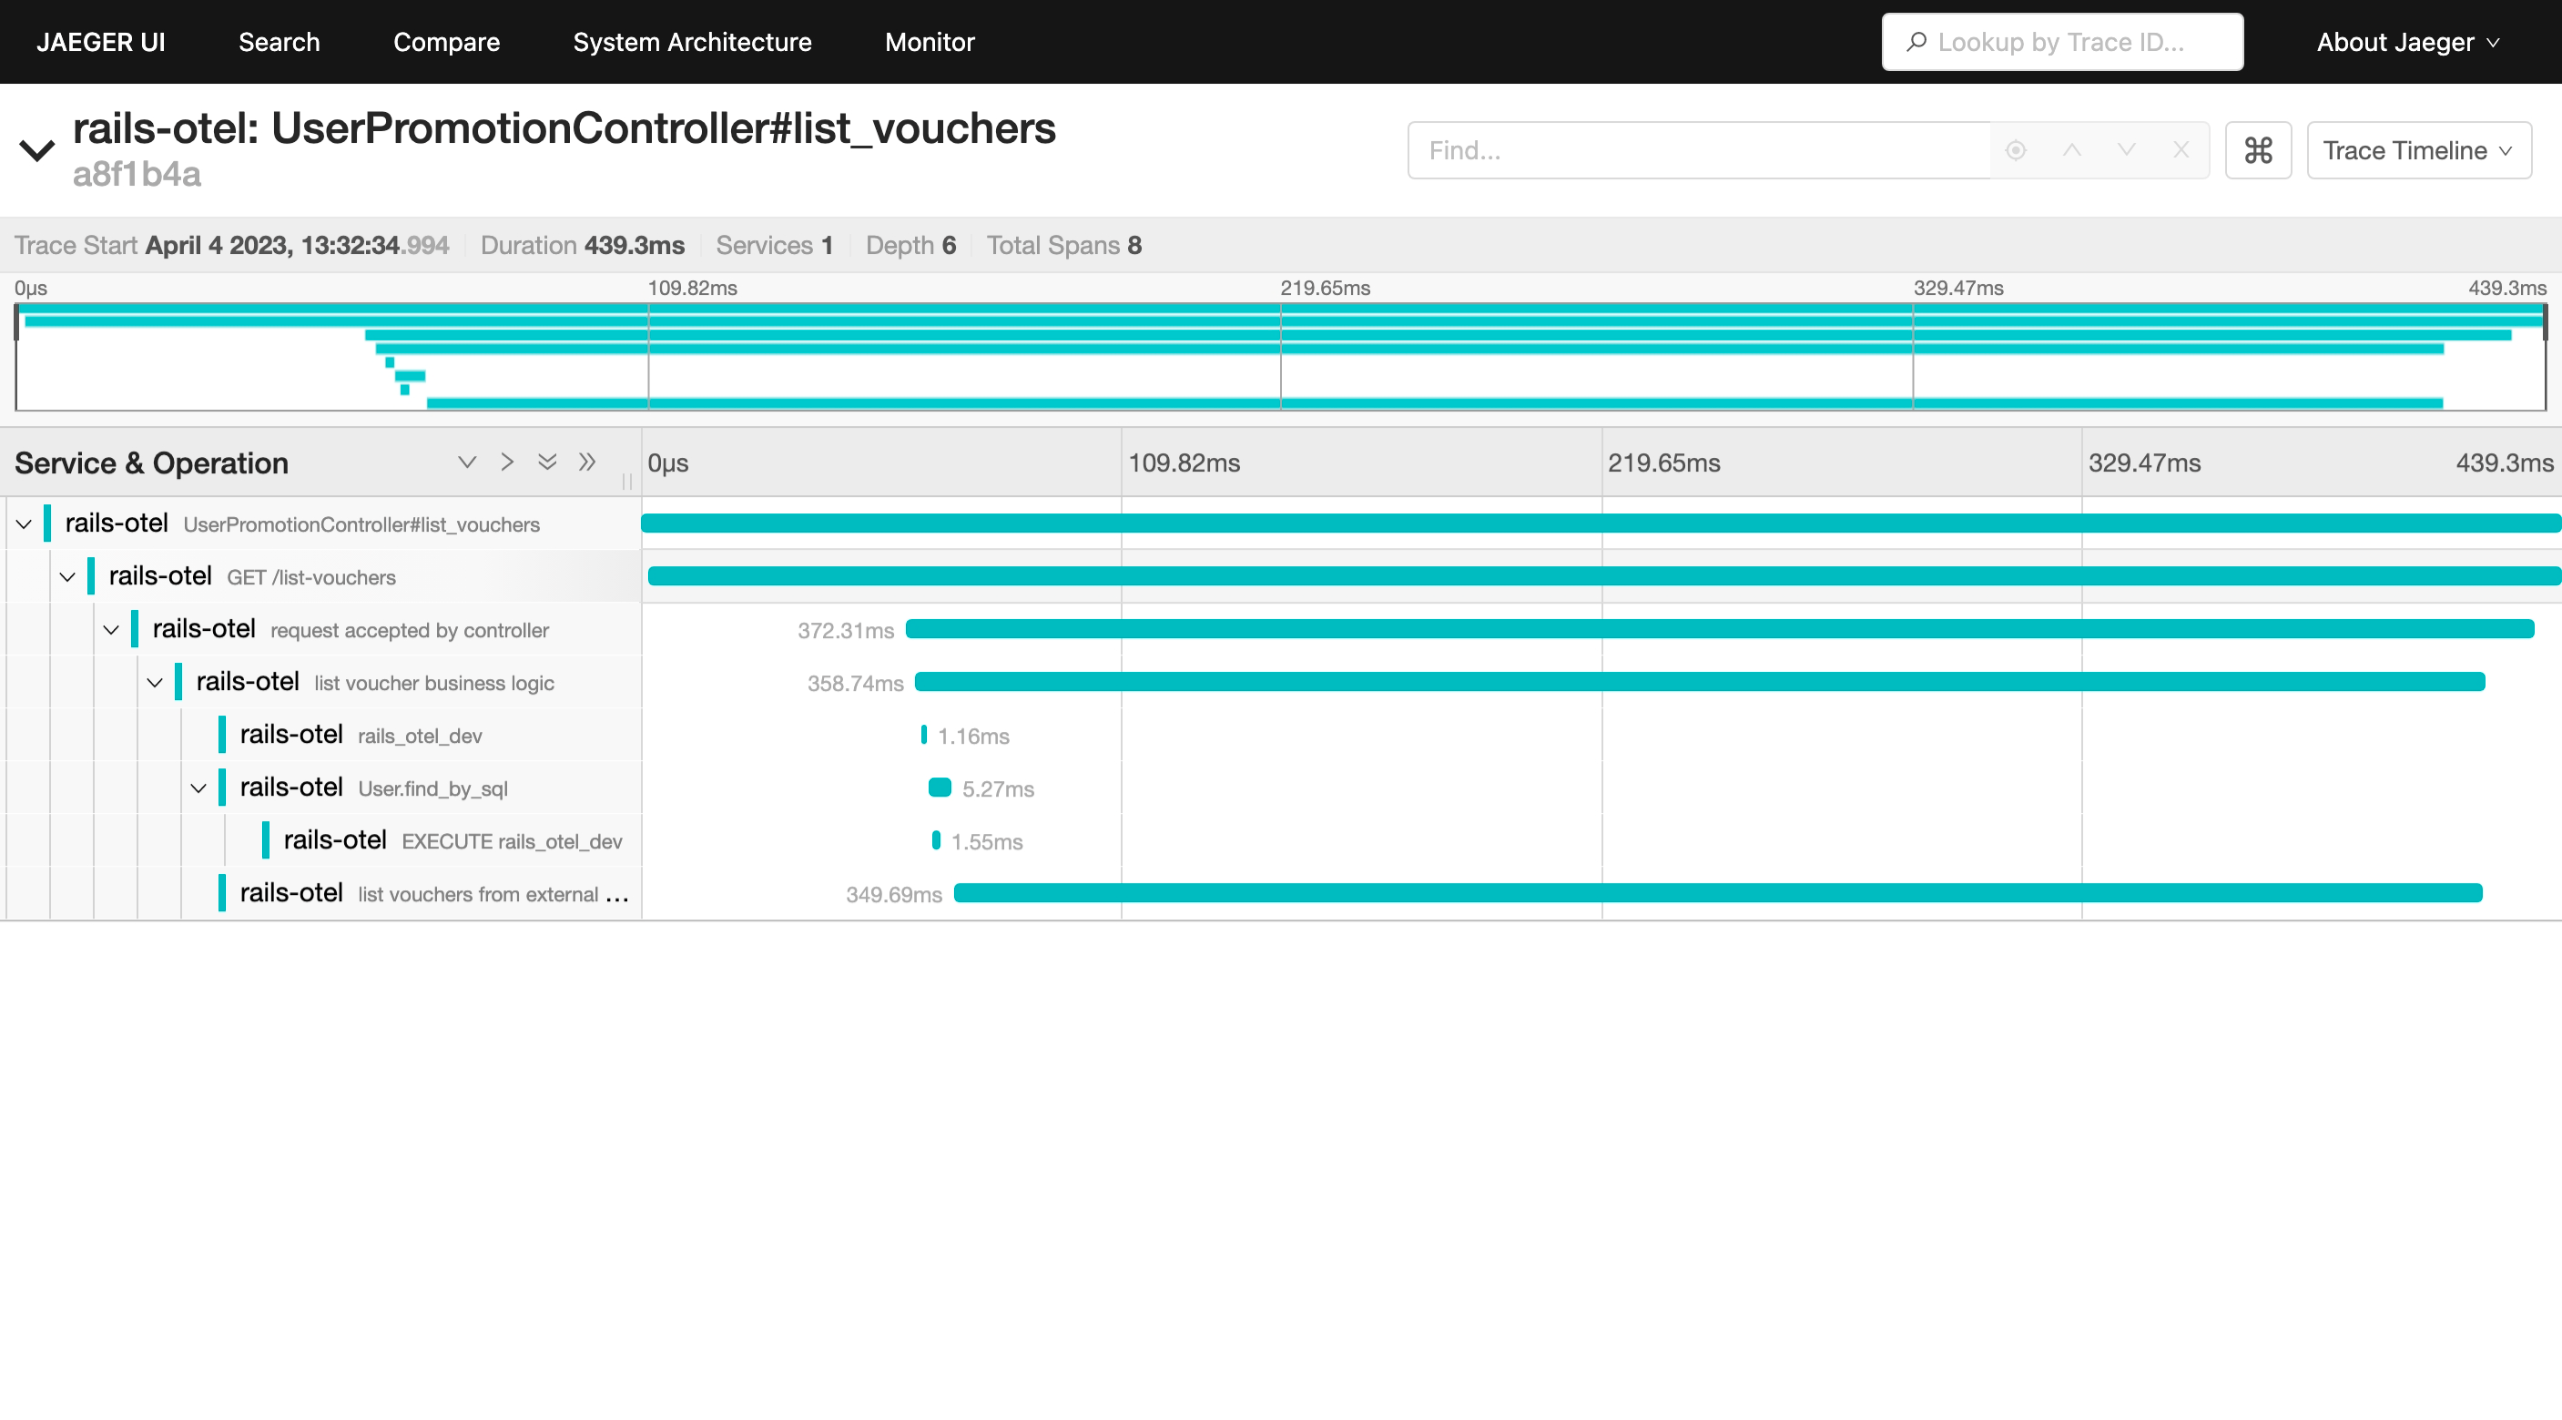
Changes on this section can be seen at this commit 89bd3f9.
Conclusion #
After installing OpenTelemetry and duck-typing some classes, now we have all our log formatted to JSON.
Now we can pipe this log into Elasticsearch or any logging tools that support query. By using that, we can easily to group the log based on trace_id.