Better Observability on Ruby on Rails Logs with OpenTelemetry Trace and Span ID
February 24, 2023
Ruby on Rails (RoR) is a common framework used by Ruby developers when building web application. It ships with common libraries from logger to active record (for easily querying from database). But, like many current framework in others programming language, we need to write some extra code to make our application easier to observe and debug. For example, on small traffic application we may satisfied by printing some logging such as:
myapp  | Started GET "/list-vouchers" for 192.168.32.1 at 2023-03-09 03:26:00 +0000
myapp  | Cannot render console from 192.168.32.1! Allowed networks: 127.0.0.0/127.255.255.255, ::1
myapp  |   ActiveRecord::SchemaMigration Pluck (1.8ms)  SELECT "schema_migrations"."version" FROM "schema_migrations" ORDER BY "schema_migrations"."version" ASC
myapp  | Processing by UserPromotionController#list_vouchers as HTML
myapp  | request accepted by controller
myapp  | accepting token from headers
myapp  | validating JWT
myapp  | reaching business logic
myapp  | doing query get user by id c8c6991c-687e-44cc-8755-4743ef66d265
myapp  |   User Load (2.2ms)  SELECT "users".* FROM "users" WHERE "users"."id" = $1 LIMIT $2  [["id", "c8c6991c-687e-44cc-8755-4743ef66d265"], ["LIMIT", 1]]
myapp  |   ↳ app/services/vouchers/user_voucher.rb:7:in `vouchers'
myapp  | calling PromotionService.list_vouchers from UserVoucher.list_vouchers c8c6991c-687e-44cc-8755-4743ef66d265
myapp  | PromotionService.list_vouchers call started
myapp  | PromotionService.list_vouchers done
myapp  | controller done processing the request, preparing rendering response
myapp  | Completed 200 OK in 314ms (Views: 12.1ms | ActiveRecord: 9.0ms | Allocations: 8720)
This log is taken from the code from the Rails app that I write in part 1.
But, as our web application traffic become heavy, it will become hard to pinpoint on specific user’s request journey.
Let me tell you why this will become the problem and how we can improve this.
Supposed you have 16 line of log above, repeated multiple times because of high traffic, then:
- How you can ensure that the next line of the log is sequentially correspond with the previous line?
- How you will group the log based on one request journey?
- How can we sorting by time? It is text based, then if you successfully sort that, it probably you’re sorting the whole line (not specific by time).
- And another question on how we get the better sense of the log.
The Problem #
The default Rails log output is hard to debug. I think it is not only me who feel that. Even ChatGPT tell me this when I asked why rails app log hard to debug:
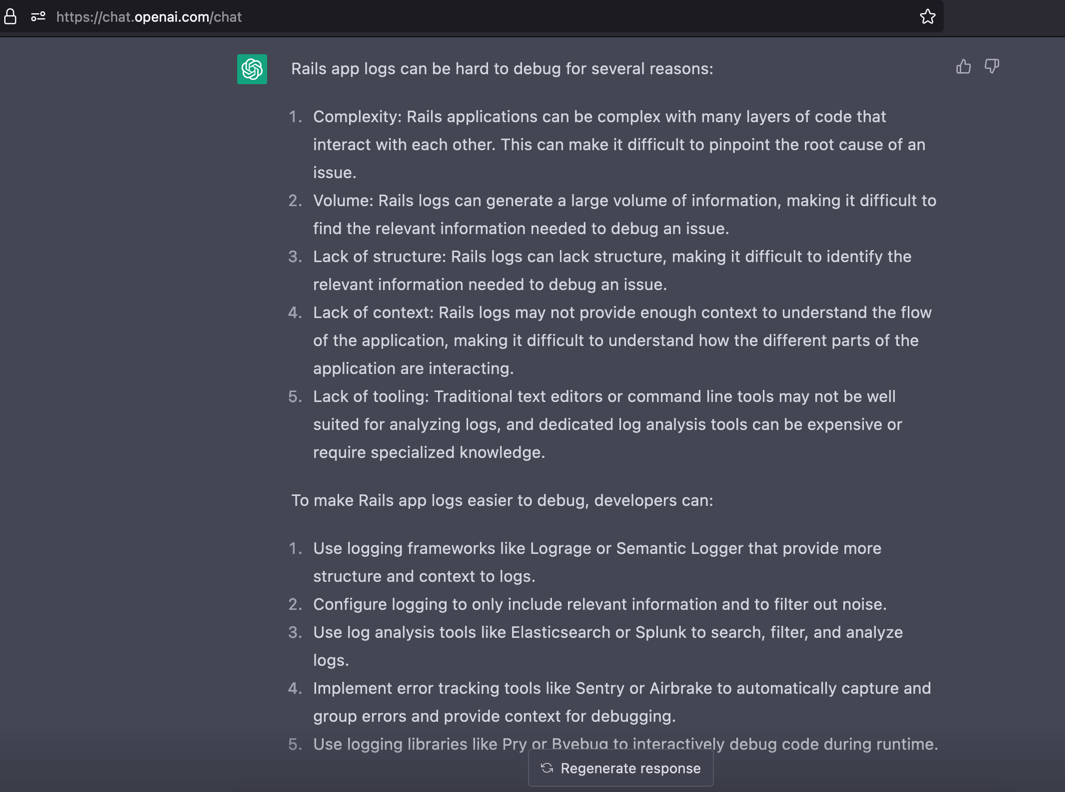
Below is the ChatGPT generated text
Rails app logs can be hard to debug for several reasons:
- Complexity: Rails applications can be complex with many layers of code that interact with each other. This can make it difficult to pinpoint the root cause of an issue.
- Volume: Rails logs can generate a large volume of information, making it difficult to find the relevant information needed to debug an issue.
- Lack of structure: Rails logs can lack structure, making it difficult to identify the relevant information needed to debug an issue.
- Lack of context: Rails logs may not provide enough context to understand the flow of the application, making it difficult to understand how the different parts of the application are interacting.
- Lack of tooling: Traditional text editors or command line tools may not be well suited for analyzing logs, and dedicated log analysis tools can be expensive or require specialized knowledge.
To make Rails app logs easier to debug, developers can:
- Use logging frameworks like Lograge or Semantic Logger that provide more structure and context to logs.
- Configure logging to only include relevant information and to filter out noise.
- Use log analysis tools like Elasticsearch or Splunk to search, filter, and analyze logs.
- Implement error tracking tools like Sentry or Airbrake to automatically capture and group errors and provide context for debugging.
- Use logging libraries like Pry or Byebug to interactively debug code during runtime.
End of ChatGPT generated text
In this part, I will not talk much about it. I will explain why it become problem in the Part 2 with an example and then try to solve it. But, before jump to solution, I must prepare the clean Rails Application in the Part 1 as I haven’t touch the Ruby on Rails for years.
Each section on each part will always include with the specific commit id. It will help you (and me in the future) to follow the tutorial, so we can reproduce by running git checkout and docker compose up --build --force-recreate, and we will get the similar result as shown in this tutorial.
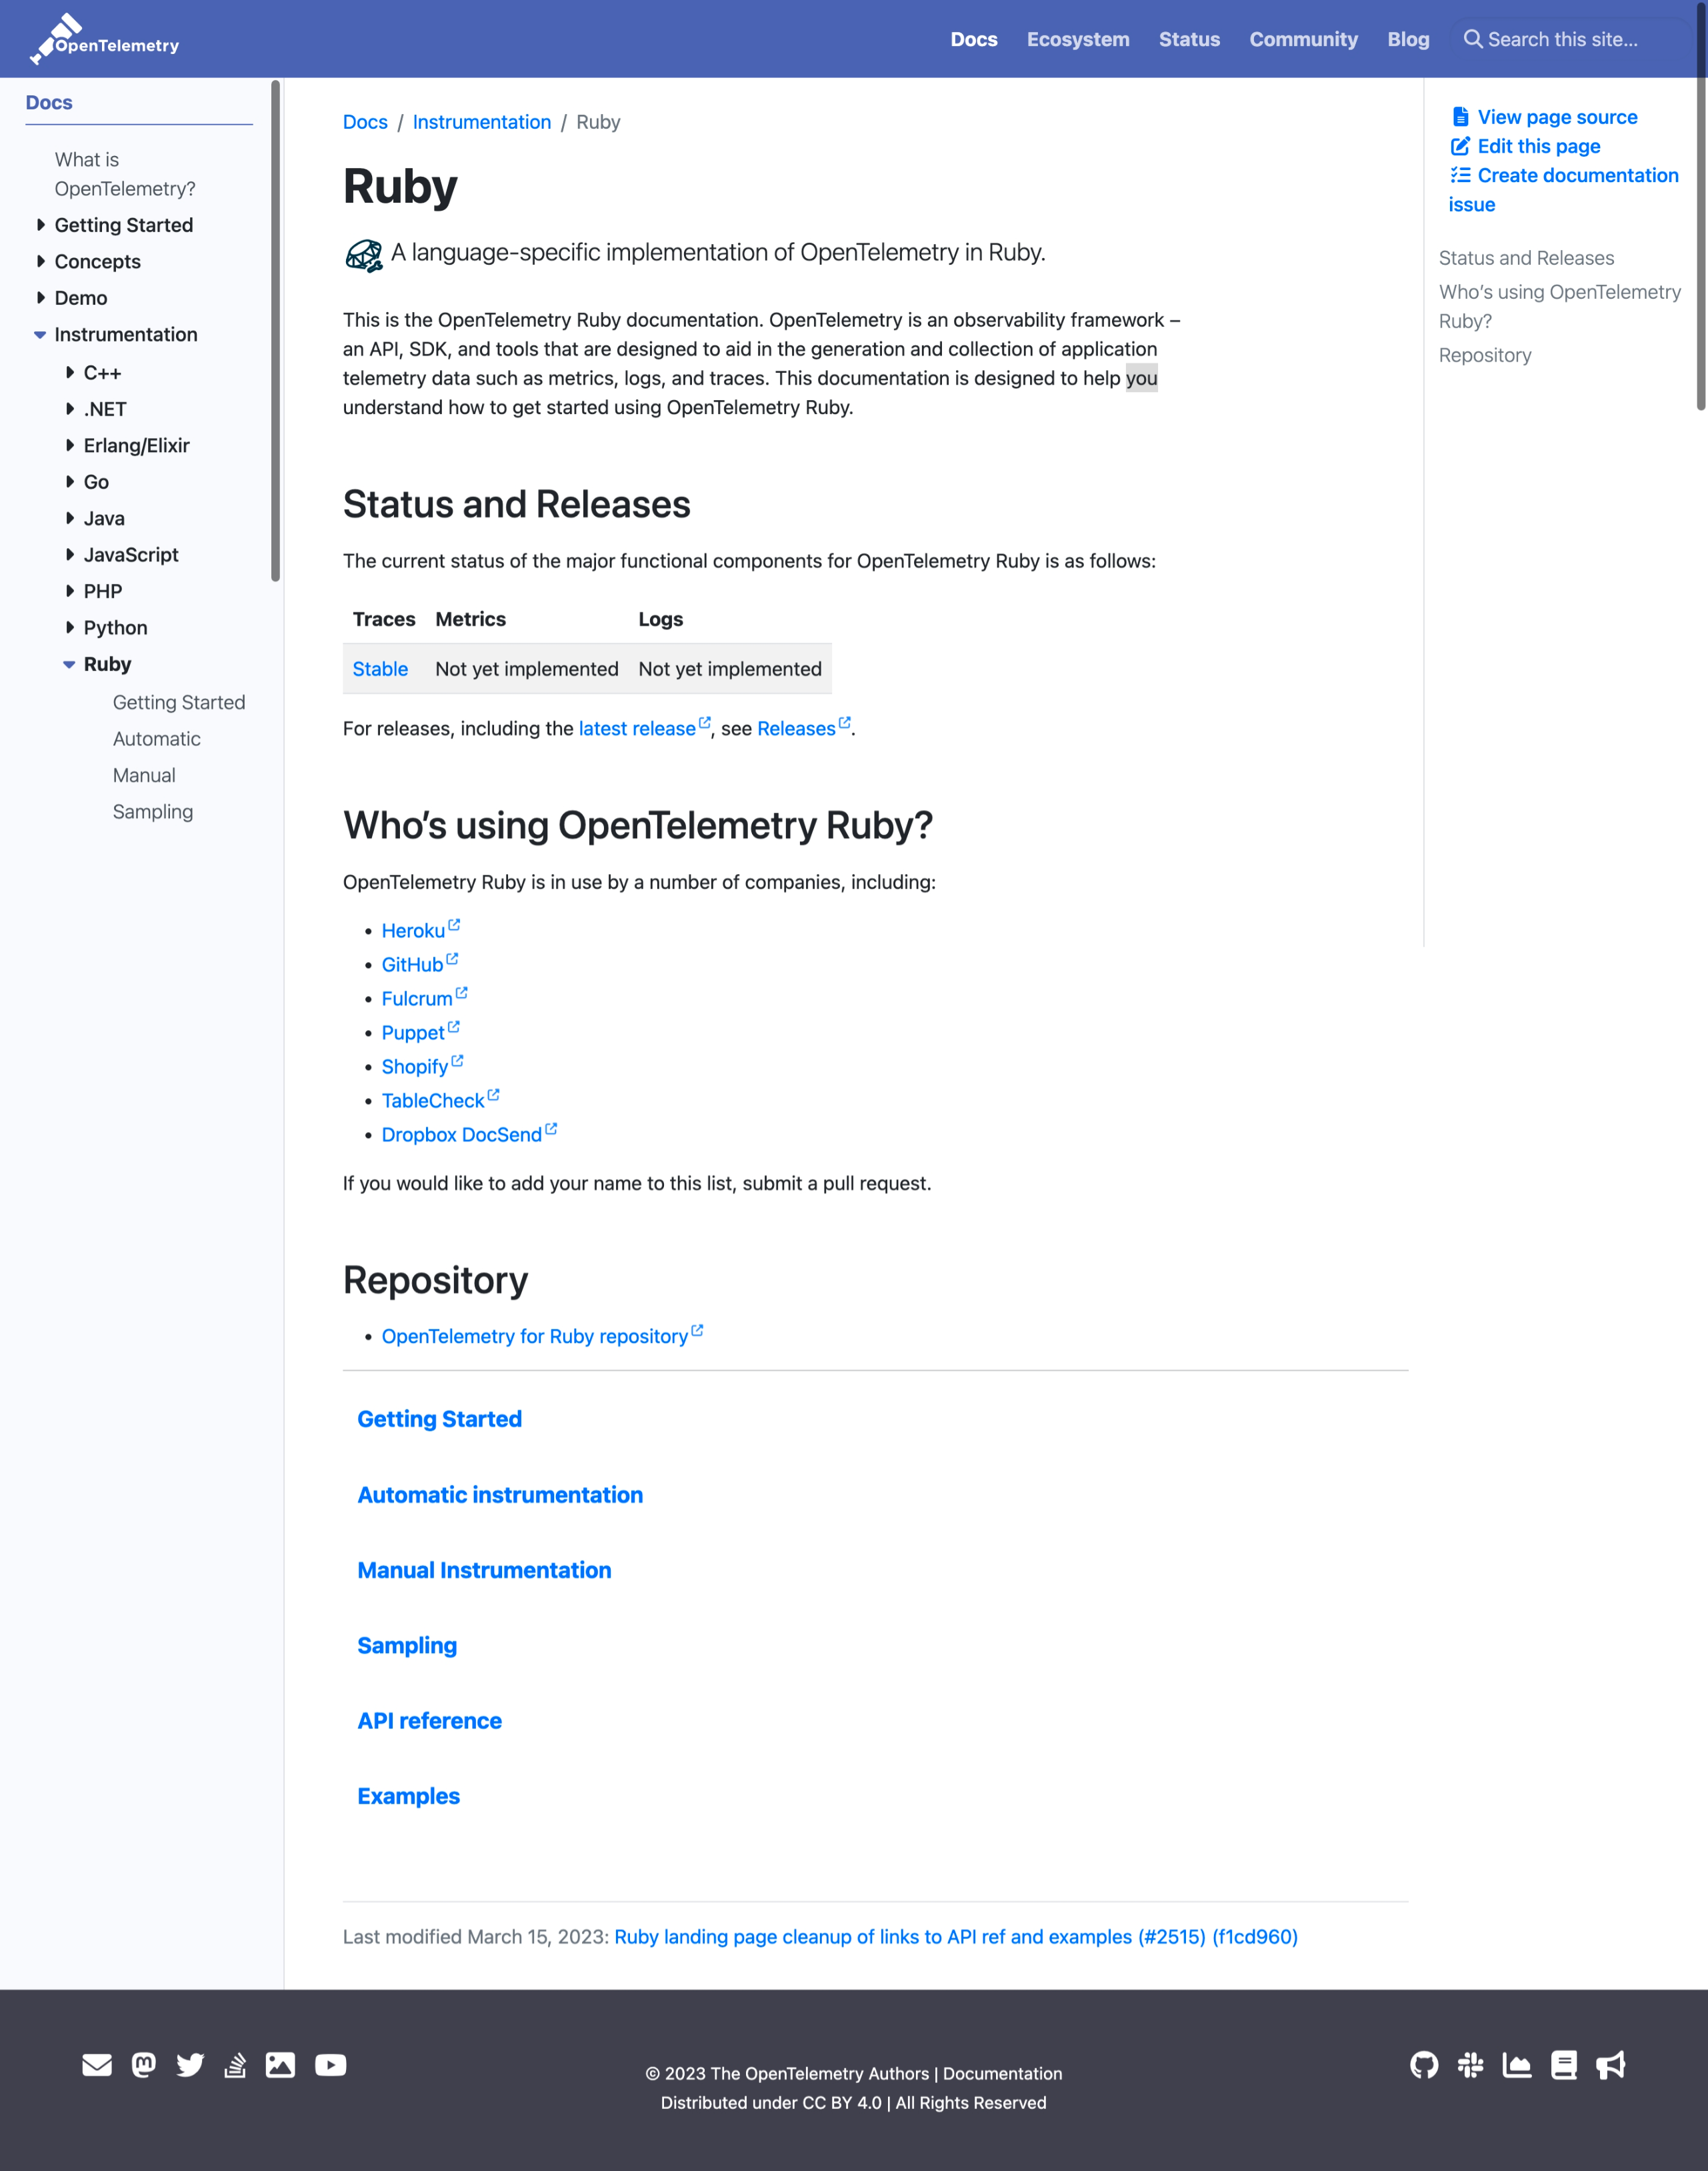
Using OpenTelemetry to Trace User Journey #
OpenTelemetry came as a set of standard to make developer (and also ops) easier to see the application traces, metrics and logs by instrumenting the code. But, when this tutorial is written, the OpenTelemetry SDK for Ruby version 1.2.0 (with commit id ad7c3b9c4fcdf2f74705a9ac08310b7067e97162) not supports OpenTelemetry Metric and Logging.
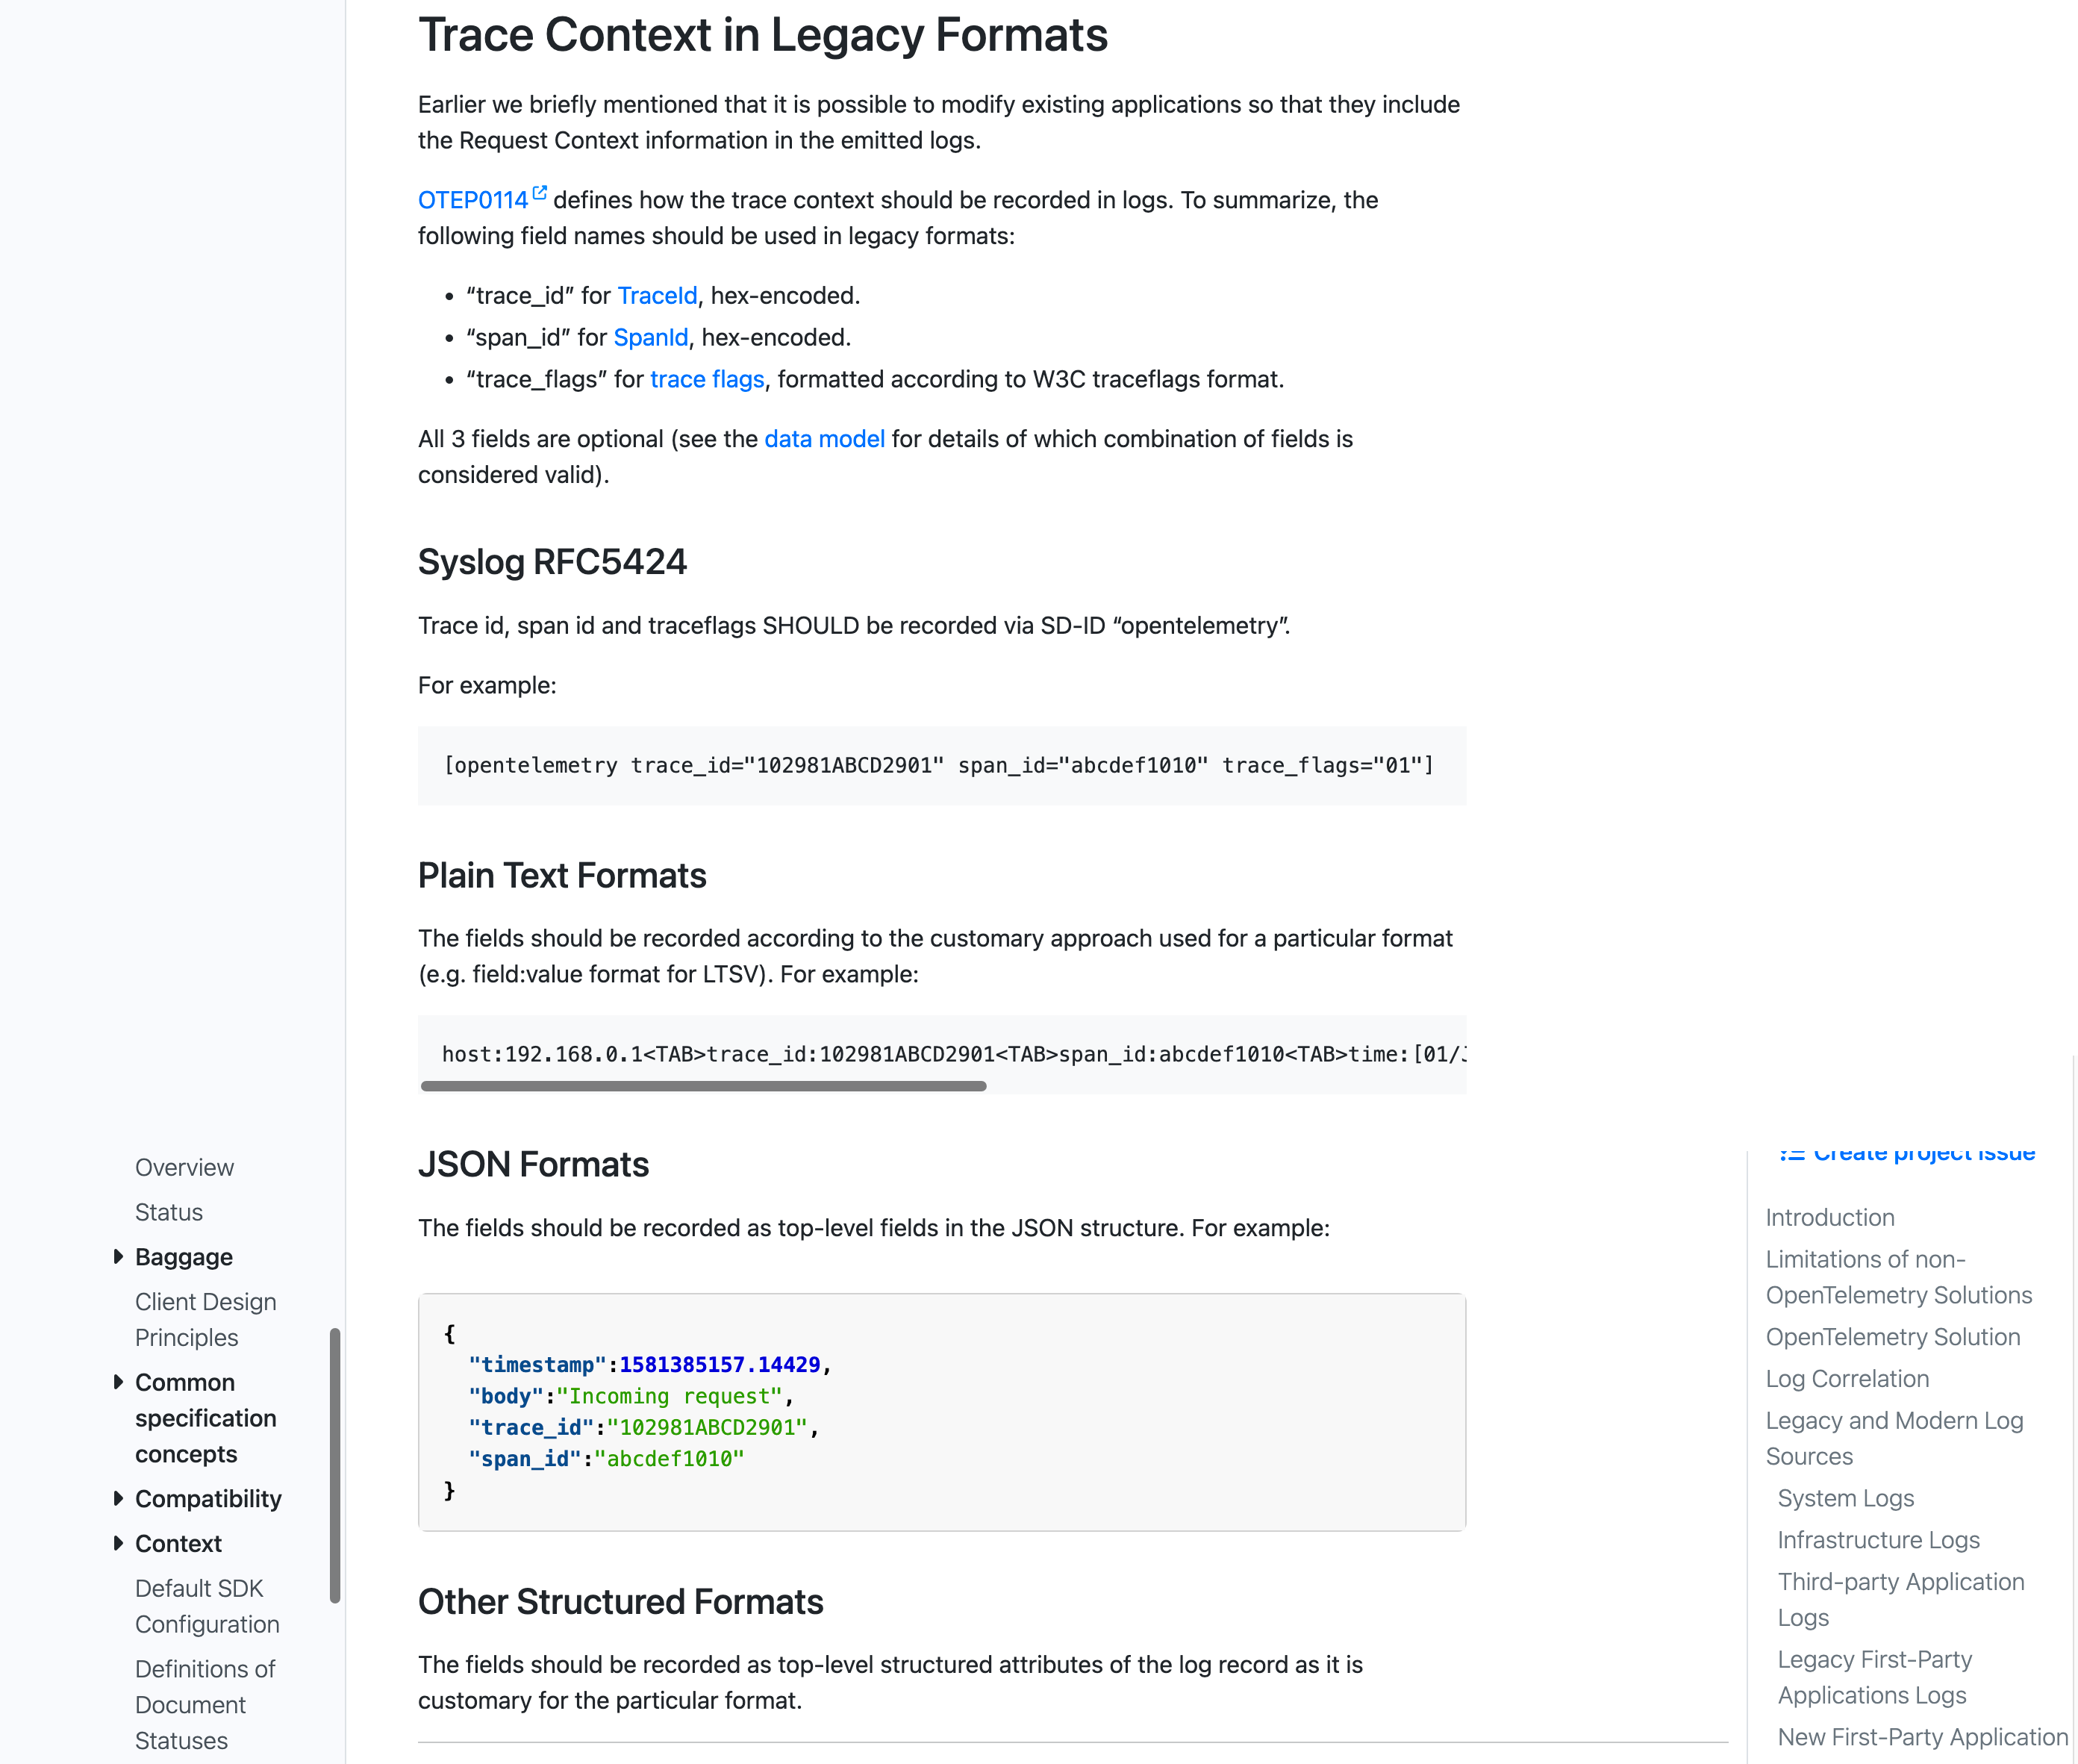
So, as the workaround to make standard logging that can be linked to the trace, we need to implement the OTEP0114 which add these property in our existing log output:
- “trace_id” hex-encoded.
- “span_id” hex-encoded.
- “trace_flags” formatted according to W3C
traceflagsformat.
References:
Using JSON as the Log Format Output #
In the OpenTelemetry page discussing
Trace Context in Legacy Formats, there no advice to use JSON format over the
Syslog RFC5424 or other format. But in my opinion, using JSON as the log format output will make debugging more easier because it can be stored into NoSQL database and then query it. In result, by able to query the logs, we can group the logs based on trace_id which means that all logs with the same trace_id are produced by the one request journey from the client.
Part 1: Preparing the Ruby on Rails Application #
If you are new to the Ruby on Rails, you can follow this part 1. Otherwise, go to Part 2.
Part 2: Improving Log Output #
Go to this link for the Part 2.